
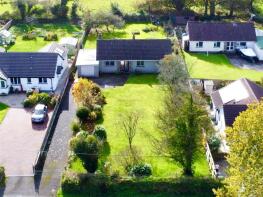
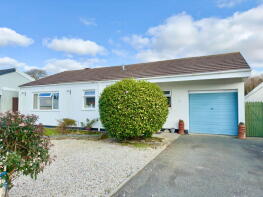
House Prices in Hengar
House prices in Hengar have an overall average of £365,572 over the last year.
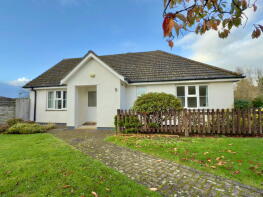
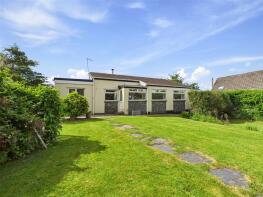
The majority of properties sold in Hengar during the last year were detached properties, selling for an average price of £448,831. Semi-detached properties sold for an average of £250,857, with terraced properties fetching £101,000.
Overall, the historical sold prices in Hengar over the last year were 31% down on the previous year and 24% down on the 2022 peak of £482,900.
Properties Sold
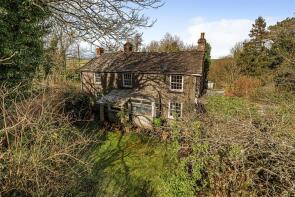
Stubbings, Tremeer Lane, St Tudy, Bodmin PL30 3NF
| Today | See what it's worth now |
| 19 Mar 2026 | £470,000 |
| 26 Jan 2001 | £150,000 |
No other historical records.
9, Glebe Parc, St Tudy, Bodmin PL30 3AS
| Today | See what it's worth now |
| 19 Mar 2026 | £270,000 |
| 9 Jan 2015 | £189,950 |
19, Valley View, St Teath, Bodmin PL30 3LQ
| Today | See what it's worth now |
| 16 Mar 2026 | £185,000 |
No other historical records.
Palm Cottage, Fore Street, St Teath, Bodmin PL30 3JA
| Today | See what it's worth now |
| 12 Feb 2026 | £92,000 |
| 23 Apr 2015 | £157,000 |
Clarkswell, Michaelstow, Bodmin PL30 3PD
| Today | See what it's worth now |
| 20 Jan 2026 | £200,000 |
No other historical records.
47, Trehannick Close, St Teath, Bodmin PL30 3LF
| Today | See what it's worth now |
| 6 Jan 2026 | £225,000 |
| 13 Sep 1996 | £52,000 |
No other historical records.
Woodbine Cottage, A389 Between Shepherds Hill And Mount Charles, Washaway, Bodmin PL30 3AD
| Today | See what it's worth now |
| 5 Jan 2026 | £425,000 |
| 21 Dec 2020 | £325,000 |
Lyn Melynor, Wetherham Lane, St Tudy, Bodmin PL30 3NG
| Today | See what it's worth now |
| 19 Dec 2025 | £650,000 |
| 24 Sep 1996 | £120,000 |
No other historical records.
Filkins Cottage, Road From Trelill Road To St Kew Highway, St Kew Highway, Bodmin PL30 3DP
| Today | See what it's worth now |
| 12 Dec 2025 | £191,000 |
| 14 Jul 2011 | £225,000 |
No other historical records.
Little Tregleath, Road From Tredannick Hill To Tregleath Cottage, Washaway, Bodmin PL30 3AW
| Today | See what it's worth now |
| 10 Dec 2025 | £400,000 |
| 27 Jan 1995 | £25,000 |
No other historical records.
Chy An Vre, Knights Mill Hill, St Teath, Bodmin PL30 3JB
| Today | See what it's worth now |
| 6 Nov 2025 | £330,000 |
| 24 Sep 1999 | £70,500 |
No other historical records.
21, Trehannick Close, St Teath, Bodmin PL30 3LF

| Today | See what it's worth now |
| 5 Nov 2025 | £180,000 |
| 3 Jun 2005 | £160,000 |
3, Victoria Cottages, Road From Trelill Road To St Kew Highway, St Kew Highway, Bodmin PL30 3DP
| Today | See what it's worth now |
| 30 Oct 2025 | £110,000 |
| 13 Dec 2019 | £233,000 |
Stone Farm Barn, Access To Stone Farm Barn, St Mabyn, Bodmin PL30 3BZ
| Today | See what it's worth now |
| 24 Oct 2025 | £950,000 |
| 1 Jul 2011 | £382,000 |
Summerville House, Longstone, St Mabyn PL30 3BZ
| Today | See what it's worth now |
| 17 Oct 2025 | £505,000 |
| 30 Aug 2012 | £318,000 |
Tinkers Cottage, Snow Hill, Trelill, Bodmin PL30 3HU
| Today | See what it's worth now |
| 24 Sep 2025 | £535,000 |
No other historical records.
The Coach House, Tregaddock Lane, St Mabyn, Bodmin PL30 3DE
| Today | See what it's worth now |
| 5 Sep 2025 | £740,000 |
| 18 Nov 2020 | £550,000 |
No other historical records.
Valorna, Bokelly Lane, St Kew, Bodmin PL30 3EU
| Today | See what it's worth now |
| 1 Sep 2025 | £140,000 |
| 16 Oct 2000 | £98,500 |
No other historical records.
Meadowsweet, The Meadows, St Teath, Bodmin PL30 3LT
| Today | See what it's worth now |
| 1 Sep 2025 | £362,000 |
No other historical records.
25, Trehannick Close, St Teath, Bodmin PL30 3LF
| Today | See what it's worth now |
| 12 Aug 2025 | £220,000 |
| 2 Dec 1998 | £59,950 |
No other historical records.
1, Sedum Flower Close, St Mabyn, Bodmin PL30 3FJ
| Today | See what it's worth now |
| 6 Aug 2025 | £570,000 |
No other historical records.
Garner House, Tregreenwell Hill, St Teath, Bodmin PL30 3JJ
| Today | See what it's worth now |
| 25 Jul 2025 | £233,300 |
No other historical records.
1, Snowhill Cottage, Snow Hill, Trelill, Bodmin PL30 3HU

| Today | See what it's worth now |
| 24 Jul 2025 | £340,000 |
| 4 Aug 2004 | £277,500 |
Source Acknowledgement: © Crown copyright. England and Wales house price data is publicly available information produced by the HM Land Registry.This material was last updated on 9 July 2026. It covers the period from 1 January 1995 to 30 April 2026 and contains property transactions which have been registered during that period. Contains HM Land Registry data © Crown copyright and database right 2026. This data is licensed under the Open Government Licence v3.0.
Disclaimer: Rightmove.co.uk provides this HM Land Registry data "as is". The burden for fitness of the data relies completely with the user and is provided for informational purposes only. No warranty, express or implied, is given relating to the accuracy of content of the HM Land Registry data and Rightmove does not accept any liability for error or omission. If you have found an error with the data or need further information please contact HM Land Registry.
Permitted Use: Viewers of this Information are granted permission to access this Crown copyright material and to download it onto electronic, magnetic, optical or similar storage media provided that such activities are for private research, study or in-house use only. Any other use of the material requires the formal written permission of Land Registry which can be requested from us, and is subject to an additional licence and associated charge.
Rightmove takes no liability for your use of, or reliance on, Rightmove's Instant Valuation due to the limitations of our tracking tool listed here. Use of this tool is taken entirely at your own risk. All rights reserved.