
House Prices in Heybridge
House prices in Heybridge have an overall average of £355,554 over the last year.
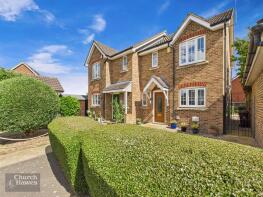
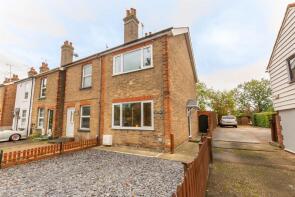
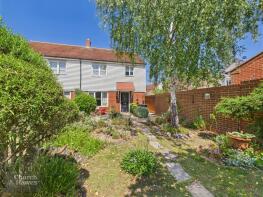
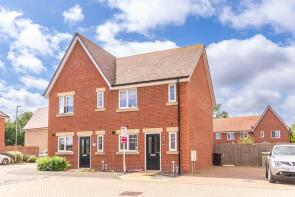
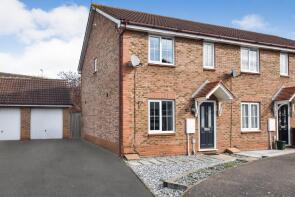
The majority of properties sold in Heybridge during the last year were semi-detached properties, selling for an average price of £344,960. Terraced properties sold for an average of £301,148, with detached properties fetching £462,692.
Overall, the historical sold prices in Heybridge over the last year were 7% down on the previous year and 2% down on the 2022 peak of £364,028.
Properties Sold
24, Mayland Close, Maldon CM9 4YR
| Today | See what it's worth now |
| 23 Apr 2026 | £415,000 |
| 27 Feb 2025 | £350,000 |
6, Sanderling Gardens, Maldon CM9 4TP

| Today | See what it's worth now |
| 2 Apr 2026 | £257,500 |
| 22 Nov 2002 | £115,000 |
No other historical records.
6, Cloughton Court, Triangle Place, Maldon CM9 4BT
| Today | See what it's worth now |
| 2 Apr 2026 | £190,000 |
| 10 Jun 2016 | £179,950 |
No other historical records.
Flat 4, Drakkar Wharf, Anchor Lane, Maldon CM9 4LP
| Today | See what it's worth now |
| 30 Mar 2026 | £238,000 |
| 9 Nov 2021 | £225,000 |
No other historical records.
55, Heywood Way, Heybridge CM9 4BH
| Today | See what it's worth now |
| 27 Mar 2026 | £270,000 |
No other historical records.
10, Wave Bridge Court, Colchester Road, Maldon CM9 4UY
| Today | See what it's worth now |
| 27 Mar 2026 | £167,500 |
| 18 Aug 2006 | £115,000 |
173, Heywood Way, Maldon CM9 4BJ
| Today | See what it's worth now |
| 27 Mar 2026 | £362,500 |
| 17 Nov 2010 | £183,000 |
17, Crescent Road, Maldon CM9 4SJ
| Today | See what it's worth now |
| 26 Mar 2026 | £375,000 |
| 16 Aug 2018 | £315,000 |
12, Doubleday Drive, Maldon CM9 4TL
| Today | See what it's worth now |
| 20 Mar 2026 | £477,500 |
| 31 May 2019 | £351,500 |
21, Abbotsmead, Maldon CM9 4PT
| Today | See what it's worth now |
| 18 Mar 2026 | £345,000 |
| 16 Jun 2008 | £205,000 |
8 The Nook, Basin Road, Maldon CM9 4RG

| Today | See what it's worth now |
| 16 Mar 2026 | £530,000 |
| 23 Nov 2022 | £547,500 |
157, Holloway Road, Maldon CM9 4SW
| Today | See what it's worth now |
| 13 Mar 2026 | £330,000 |
| 16 Aug 2019 | £285,000 |
11, Anchor Lane, Maldon CM9 4LS
| Today | See what it's worth now |
| 13 Mar 2026 | £380,000 |
| 10 Sep 2010 | £227,000 |
No other historical records.
11, Oliver Close, Maldon CM9 4PJ
| Today | See what it's worth now |
| 10 Mar 2026 | £390,000 |
| 20 Apr 2012 | £222,000 |
29, Barbrook Avenue, Maldon CM9 4DR
| Today | See what it's worth now |
| 6 Mar 2026 | £338,000 |
| 25 Feb 2022 | £330,000 |
29, Wagtail Drive, Maldon CM9 4UD
| Today | See what it's worth now |
| 6 Mar 2026 | £365,000 |
| 15 Aug 2012 | £162,000 |
77, Cedar Chase, Heybridge CM9 4NR
| Today | See what it's worth now |
| 27 Feb 2026 | £355,000 |
No other historical records.
Sunnyview, Goldhanger Road, Heybridge CM9 4QS
| Today | See what it's worth now |
| 26 Feb 2026 | £595,000 |
| 8 Feb 2024 | £410,000 |
No other historical records.
28 Owl House, Redshank Drive, Maldon CM9 4UE
| Today | See what it's worth now |
| 20 Feb 2026 | £217,000 |
| 23 May 2001 | £59,950 |
23, Temple Way, Maldon CM9 4PX
| Today | See what it's worth now |
| 12 Feb 2026 | £346,000 |
| 26 May 2006 | £187,500 |
1, Heybridge Woods View, Maldon CM9 4DN
| Today | See what it's worth now |
| 23 Jan 2026 | £395,000 |
| 30 Oct 2020 | £355,000 |
No other historical records.
6, Myall Close, Maldon CM9 4DU
| Today | See what it's worth now |
| 9 Jan 2026 | £326,000 |
| 31 Jan 2019 | £299,995 |
No other historical records.
79, Hillary Close, Maldon CM9 4UB
| Today | See what it's worth now |
| 9 Jan 2026 | £305,000 |
| 14 Mar 2022 | £270,000 |
Source Acknowledgement: © Crown copyright. England and Wales house price data is publicly available information produced by the HM Land Registry.This material was last updated on 9 July 2026. It covers the period from 1 January 1995 to 30 April 2026 and contains property transactions which have been registered during that period. Contains HM Land Registry data © Crown copyright and database right 2026. This data is licensed under the Open Government Licence v3.0.
Disclaimer: Rightmove.co.uk provides this HM Land Registry data "as is". The burden for fitness of the data relies completely with the user and is provided for informational purposes only. No warranty, express or implied, is given relating to the accuracy of content of the HM Land Registry data and Rightmove does not accept any liability for error or omission. If you have found an error with the data or need further information please contact HM Land Registry.
Permitted Use: Viewers of this Information are granted permission to access this Crown copyright material and to download it onto electronic, magnetic, optical or similar storage media provided that such activities are for private research, study or in-house use only. Any other use of the material requires the formal written permission of Land Registry which can be requested from us, and is subject to an additional licence and associated charge.
Rightmove takes no liability for your use of, or reliance on, Rightmove's Instant Valuation due to the limitations of our tracking tool listed here. Use of this tool is taken entirely at your own risk. All rights reserved.