
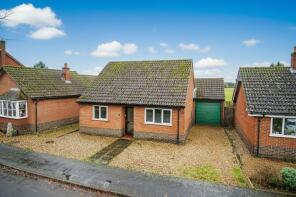
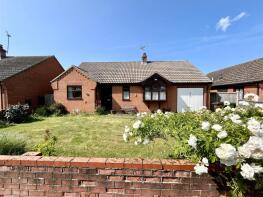
House Prices in Hingham
House prices in Hingham have an overall average of £387,638 over the last year.
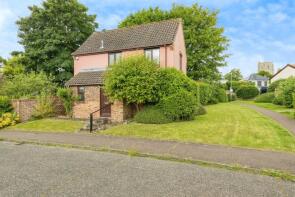
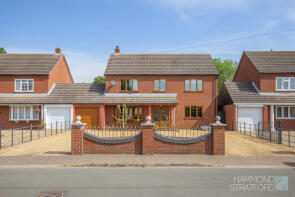
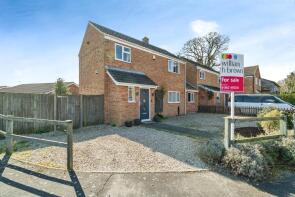
The majority of properties sold in Hingham during the last year were detached properties, selling for an average price of £429,333. Semi-detached properties sold for an average of £329,722, with terraced properties fetching £424,750.
Overall, the historical sold prices in Hingham over the last year were 13% up on the previous year and 11% up on the 2023 peak of £347,682.
Properties Sold
8, Rectory Gardens, Norwich NR9 4RG
| Today | See what it's worth now |
| 17 Apr 2026 | £230,000 |
| 9 May 2012 | £155,000 |
44, Rectory Gardens, Norwich NR9 4RG

| Today | See what it's worth now |
| 27 Mar 2026 | £135,000 |
| 28 Jul 2021 | £131,500 |
4, Folly Lane, Norwich NR9 4JE

| Today | See what it's worth now |
| 26 Mar 2026 | £500,000 |
| 9 Apr 2018 | £300,000 |
No other historical records.
8, Oak Lane, Norwich NR9 4JY

| Today | See what it's worth now |
| 19 Mar 2026 | £432,000 |
| 6 Dec 2013 | £250,000 |
13, Hopsack Road, Norwich NR9 4FB
| Today | See what it's worth now |
| 13 Mar 2026 | £315,000 |
| 3 Feb 2017 | £275,000 |
No other historical records.
The Coach House, Chapel Street, Norwich NR9 4JH

| Today | See what it's worth now |
| 19 Jan 2026 | £445,500 |
| 25 Jan 2022 | £295,000 |
5, Glebe Close, Norwich NR9 4HF
| Today | See what it's worth now |
| 16 Jan 2026 | £300,000 |
| 19 Oct 2007 | £210,000 |
5, Lonsdale Crescent, Norwich NR9 4ND

| Today | See what it's worth now |
| 14 Jan 2026 | £625,000 |
| 12 Aug 2015 | £440,000 |
4, Hall Moor Road, Hingham NR9 4LB
| Today | See what it's worth now |
| 19 Dec 2025 | £340,000 |
| 5 Jul 2024 | £250,000 |
No other historical records.
9, Baxter Close, Norwich NR9 4HZ
| Today | See what it's worth now |
| 17 Dec 2025 | £297,500 |
| 28 Jun 2021 | £280,000 |
4 Mistletoe Cottage, Pitts Square, Norwich NR9 4LD
| Today | See what it's worth now |
| 4 Dec 2025 | £320,000 |
| 2 Jan 2020 | £250,000 |
28, Bell Meadow, Norwich NR9 4HT
| Today | See what it's worth now |
| 28 Nov 2025 | £330,000 |
| 31 Mar 2016 | £242,500 |
2, Lonsdale Crescent, Norwich NR9 4ND
| Today | See what it's worth now |
| 25 Nov 2025 | £515,000 |
| 24 Jun 2008 | £300,000 |
No other historical records.
9, Lincoln Close, Norwich NR9 4LZ

| Today | See what it's worth now |
| 4 Nov 2025 | £144,000 |
| 5 Jun 2024 | £103,000 |
No other historical records.
13, Baxter Close, Norwich NR9 4HZ
| Today | See what it's worth now |
| 27 Oct 2025 | £425,001 |
| 27 Sep 2018 | £245,000 |
The Green Cottage, Watton Road, Norwich NR9 4NN
| Today | See what it's worth now |
| 24 Oct 2025 | £815,000 |
| 22 Sep 2014 | £181,000 |
No other historical records.
8, Dereham Road, Norwich NR9 4HU
| Today | See what it's worth now |
| 20 Oct 2025 | £320,000 |
| 15 Feb 2013 | £190,000 |
7, St Andrews Close, Hingham NR9 4JT
| Today | See what it's worth now |
| 14 Oct 2025 | £620,000 |
No other historical records.
18, Oak Lane, Norwich NR9 4JY
| Today | See what it's worth now |
| 10 Oct 2025 | £435,000 |
| 23 Aug 2017 | £350,000 |
44, Hardingham Street, Norwich NR9 4JB
| Today | See what it's worth now |
| 10 Oct 2025 | £497,500 |
| 5 Aug 2022 | £530,000 |
1, Glebe Close, Norwich NR9 4HF
| Today | See what it's worth now |
| 3 Oct 2025 | £290,000 |
| 15 Jun 2018 | £250,000 |
11, Admirals Walk, Norwich NR9 4JL

| Today | See what it's worth now |
| 3 Oct 2025 | £220,000 |
| 28 Jul 2022 | £228,000 |
45, Admirals Walk, Norwich NR9 4JL
| Today | See what it's worth now |
| 26 Sep 2025 | £290,000 |
| 29 Mar 2021 | £275,000 |
Source Acknowledgement: © Crown copyright. England and Wales house price data is publicly available information produced by the HM Land Registry.This material was last updated on 9 July 2026. It covers the period from 1 January 1995 to 30 April 2026 and contains property transactions which have been registered during that period. Contains HM Land Registry data © Crown copyright and database right 2026. This data is licensed under the Open Government Licence v3.0.
Disclaimer: Rightmove.co.uk provides this HM Land Registry data "as is". The burden for fitness of the data relies completely with the user and is provided for informational purposes only. No warranty, express or implied, is given relating to the accuracy of content of the HM Land Registry data and Rightmove does not accept any liability for error or omission. If you have found an error with the data or need further information please contact HM Land Registry.
Permitted Use: Viewers of this Information are granted permission to access this Crown copyright material and to download it onto electronic, magnetic, optical or similar storage media provided that such activities are for private research, study or in-house use only. Any other use of the material requires the formal written permission of Land Registry which can be requested from us, and is subject to an additional licence and associated charge.
Rightmove takes no liability for your use of, or reliance on, Rightmove's Instant Valuation due to the limitations of our tracking tool listed here. Use of this tool is taken entirely at your own risk. All rights reserved.