
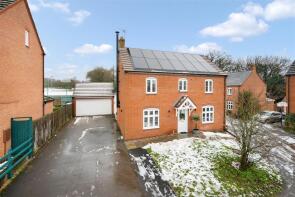
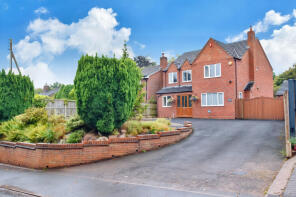
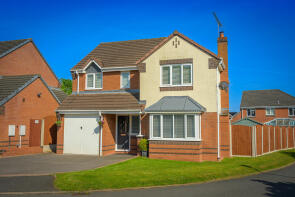
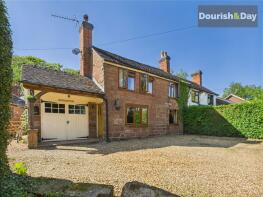
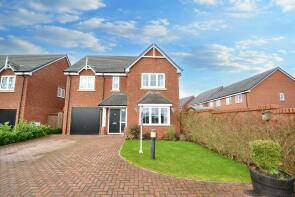
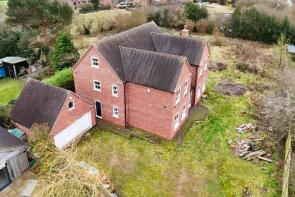
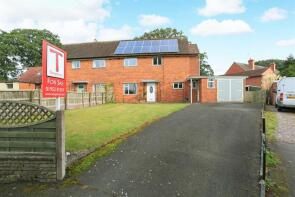
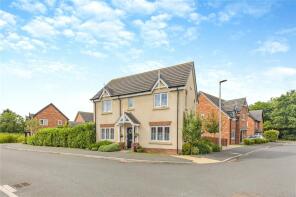
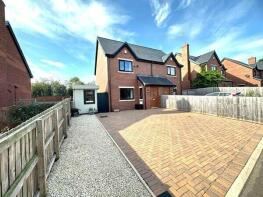
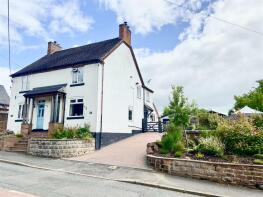
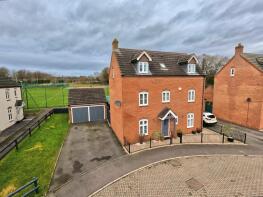
House Prices in Hinstock
House prices in Hinstock have an overall average of £418,150 over the last year.
The majority of properties sold in Hinstock during the last year were detached properties, selling for an average price of £470,812. Semi-detached properties sold for an average of £170,000, with flats fetching £245,000.
Overall, the historical sold prices in Hinstock over the last year were similar to the previous year and 18% up on the 2021 peak of £355,697.
Properties Sold
23, Sandbrook Close, Market Drayton TF9 2UD
| Today | See what it's worth now |
| 17 Apr 2026 | £450,000 |
| 20 Aug 2020 | £275,000 |
2, Moat House Gardens, Hinstock, Market Drayton TF9 2FB

| Today | See what it's worth now |
| 19 Mar 2026 | £335,000 |
| 24 May 2021 | £350,000 |
No other historical records.
Pixley View, Newport Road, Market Drayton TF9 2TL
| Today | See what it's worth now |
| 11 Mar 2026 | £440,000 |
| 30 Sep 2011 | £250,000 |
3, Roman Way, Market Drayton TF9 2SL
| Today | See what it's worth now |
| 19 Jan 2026 | £390,000 |
| 1 Jun 2012 | £220,000 |
Laburnum Cottage, Chester Road, Market Drayton TF9 2SZ
| Today | See what it's worth now |
| 18 Dec 2025 | £410,000 |
| 25 May 2001 | £108,000 |
16, Damson Way, Market Drayton TF9 2UG
| Today | See what it's worth now |
| 12 Dec 2025 | £356,500 |
| 12 Apr 2019 | £325,000 |
No other historical records.
1, Church Street, Hinstock TF9 2TF
| Today | See what it's worth now |
| 31 Oct 2025 | £790,000 |
| 21 Mar 2025 | £630,000 |
No other historical records.
9, Villa Farm Close, Market Drayton TF9 2UE
| Today | See what it's worth now |
| 29 Oct 2025 | £595,000 |
| 27 May 2010 | £390,000 |
No other historical records.
2, The Yelves, The Links, Hinstock TF9 2NQ
| Today | See what it's worth now |
| 22 Jul 2025 | £245,000 |
No other historical records.
13, The Chestnuts, Hinstock TF9 2SX

| Today | See what it's worth now |
| 18 Jul 2025 | £170,000 |
No other historical records.
2, Meadow Brook, Marsh Lane, Market Drayton TF9 2TG
| Today | See what it's worth now |
| 11 Jun 2025 | £810,000 |
| 24 Aug 2018 | £585,000 |
No other historical records.
7, Damson Way, Market Drayton TF9 2UG

| Today | See what it's worth now |
| 23 May 2025 | £330,000 |
| 9 Aug 2021 | £335,000 |
6, Damson Way, Market Drayton TF9 2UG
| Today | See what it's worth now |
| 15 Apr 2025 | £280,000 |
| 30 Nov 2018 | £250,000 |
No other historical records.
24, Highfield Way, Market Drayton TF9 2UF

| Today | See what it's worth now |
| 14 Mar 2025 | £237,500 |
| 26 Oct 2018 | £204,000 |
No other historical records.
8, Highfield Way, Market Drayton TF9 2UF
| Today | See what it's worth now |
| 28 Feb 2025 | £205,000 |
| 4 Aug 2022 | £185,000 |
4, Orchard Grove, Market Drayton TF9 2SY
| Today | See what it's worth now |
| 21 Feb 2025 | £385,000 |
| 26 Apr 2019 | £265,000 |
30, Sandbrook Close, Hinstock TF9 2UD

| Today | See what it's worth now |
| 11 Dec 2024 | £348,000 |
No other historical records.
1, School Bank, Market Drayton TF9 2TE
| Today | See what it's worth now |
| 13 Nov 2024 | £290,000 |
| 1 Dec 2017 | £172,500 |
Woodhouse, Hatton Road, Hinstock TF9 2TY

| Today | See what it's worth now |
| 8 Nov 2024 | £790,000 |
| 1 Mar 2019 | £670,000 |
The Conifers, High Heath, Hinstock TF9 2SY
| Today | See what it's worth now |
| 27 Sep 2024 | £465,000 |
No other historical records.
4, Highfield Way, Market Drayton TF9 2UF

| Today | See what it's worth now |
| 3 Sep 2024 | £283,000 |
| 5 Nov 2021 | £282,500 |
33, Highfield Way, Market Drayton TF9 2UF

| Today | See what it's worth now |
| 19 Jul 2024 | £340,000 |
| 10 Jul 2018 | £255,000 |
No other historical records.
Springfield, Manor Close, Hinstock TF9 2TZ

| Today | See what it's worth now |
| 17 May 2024 | £515,000 |
No other historical records.

Source Acknowledgement: © Crown copyright. England and Wales house price data is publicly available information produced by the HM Land Registry.This material was last updated on 9 July 2026. It covers the period from 1 January 1995 to 30 April 2026 and contains property transactions which have been registered during that period. Contains HM Land Registry data © Crown copyright and database right 2026. This data is licensed under the Open Government Licence v3.0.
Disclaimer: Rightmove.co.uk provides this HM Land Registry data "as is". The burden for fitness of the data relies completely with the user and is provided for informational purposes only. No warranty, express or implied, is given relating to the accuracy of content of the HM Land Registry data and Rightmove does not accept any liability for error or omission. If you have found an error with the data or need further information please contact HM Land Registry.
Permitted Use: Viewers of this Information are granted permission to access this Crown copyright material and to download it onto electronic, magnetic, optical or similar storage media provided that such activities are for private research, study or in-house use only. Any other use of the material requires the formal written permission of Land Registry which can be requested from us, and is subject to an additional licence and associated charge.
Rightmove takes no liability for your use of, or reliance on, Rightmove's Instant Valuation due to the limitations of our tracking tool listed here. Use of this tool is taken entirely at your own risk. All rights reserved.