
House Prices in Hollingrove
House prices in Hollingrove have an overall average of £563,067 over the last year.
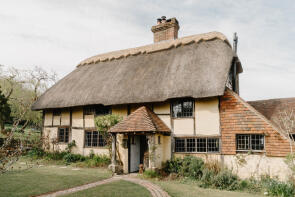
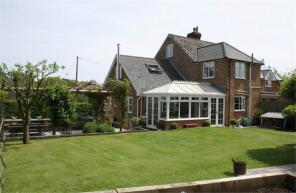
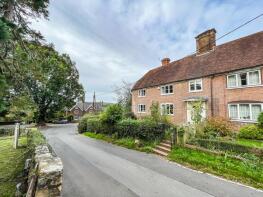
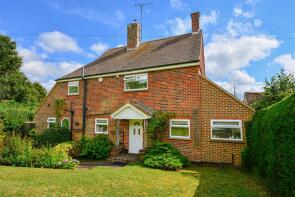
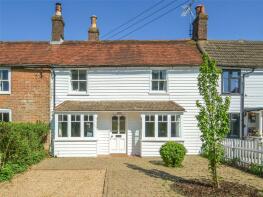
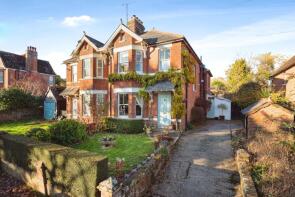
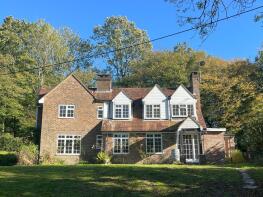
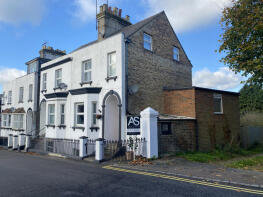
The majority of properties sold in Hollingrove during the last year were detached properties, selling for an average price of £710,331. Semi-detached properties sold for an average of £381,786, with terraced properties fetching £291,250.
Overall, the historical sold prices in Hollingrove over the last year were 7% up on the previous year and 5% down on the 2022 peak of £590,841.
Properties Sold
4, Hackwood, Robertsbridge TN32 5ER

| Today | See what it's worth now |
| 15 Dec 2025 | £555,000 |
| 7 May 2004 | £284,000 |
32, Fair Lane, Robertsbridge TN32 5AS
| Today | See what it's worth now |
| 12 Dec 2025 | £190,000 |
| 11 May 2021 | £125,500 |
Hollow Wall Oast, Rock Hill, Robertsbridge TN32 5RL
| Today | See what it's worth now |
| 10 Dec 2025 | £915,000 |
| 11 Sep 2019 | £980,000 |
19, Cricketers Field, Robertsbridge TN32 5QQ
| Today | See what it's worth now |
| 4 Dec 2025 | £320,000 |
| 27 Nov 2020 | £275,000 |
15, Northbridge Street, Robertsbridge TN32 5NY
| Today | See what it's worth now |
| 28 Nov 2025 | £285,000 |
| 5 Jan 1999 | £104,000 |
No other historical records.
Holly Tree Cottage, Hollingrove Hill, Brightling TN32 5FE
| Today | See what it's worth now |
| 17 Oct 2025 | £800,000 |
No other historical records.
2, Castle Farm Cottages, Mountfield Lane, Robertsbridge TN32 5JU
| Today | See what it's worth now |
| 16 Oct 2025 | £1,300,000 |
| 25 Aug 2015 | £417,500 |
Church Farm House, Church Lane, Robertsbridge TN32 5PJ
| Today | See what it's worth now |
| 16 Oct 2025 | £825,000 |
| 26 Jan 2006 | £440,000 |
No other historical records.
1a, Rother View, Robertsbridge TN32 5PF
| Today | See what it's worth now |
| 3 Oct 2025 | £454,300 |
| 15 Mar 2013 | £297,000 |
The Millhouse, Bodiam Road, Robertsbridge TN32 5QB
| Today | See what it's worth now |
| 26 Sep 2025 | £400,000 |
| 29 Oct 2020 | £350,000 |
Ellenwhorne Cottage, Ellenwhorne Lane, Robertsbridge TN32 5RS

| Today | See what it's worth now |
| 22 Sep 2025 | £500,000 |
| 29 Oct 2015 | £310,000 |
No other historical records.
Fairview, Brightling Road, Robertsbridge TN32 5DR
| Today | See what it's worth now |
| 19 Sep 2025 | £600,000 |
| 10 Jun 1996 | £92,500 |
No other historical records.
Riverhall Cottage, London Road, Mountfield TN32 5LP
| Today | See what it's worth now |
| 22 Aug 2025 | £585,000 |
No other historical records.
1, Station Road, Robertsbridge TN32 5DB
| Today | See what it's worth now |
| 22 Aug 2025 | £375,000 |
| 29 Jul 2016 | £352,000 |
22 Westley, Hackwood, Robertsbridge TN32 5ER
| Today | See what it's worth now |
| 22 Aug 2025 | £750,000 |
| 14 Dec 2017 | £595,000 |
Sherwood, Bellhurst Road, Robertsbridge TN32 5DW
| Today | See what it's worth now |
| 18 Aug 2025 | £740,000 |
| 9 Jul 2015 | £408,000 |
Cobblestones, Langham Road, Robertsbridge TN32 5DU

| Today | See what it's worth now |
| 18 Aug 2025 | £530,000 |
No other historical records.
Keepers Cottage, Brightling Road, Robertsbridge TN32 5EU
| Today | See what it's worth now |
| 15 Aug 2025 | £829,000 |
| 15 Jan 2010 | £455,000 |
35, Mill Rise, Robertsbridge TN32 5EG
| Today | See what it's worth now |
| 15 Aug 2025 | £595,000 |
| 8 Mar 2017 | £400,000 |
No other historical records.
2, Alma Cottages, Bodiam Road, Robertsbridge TN32 5QB
| Today | See what it's worth now |
| 6 Aug 2025 | £300,000 |
| 8 Oct 2021 | £285,000 |
11, The Tollgate, Robertsbridge TN32 5SF
| Today | See what it's worth now |
| 18 Jul 2025 | £345,000 |
| 17 Dec 2003 | £180,000 |
Holly Lodge, Eatenden Lane, Robertsbridge TN32 5LP
| Today | See what it's worth now |
| 17 Jul 2025 | £680,000 |
| 28 May 2002 | £185,000 |
No other historical records.
Old Forge Cottage, Village Street, Robertsbridge TN32 5TD
| Today | See what it's worth now |
| 11 Jul 2025 | £620,000 |
| 31 Oct 2017 | £622,000 |
2, Northbridge Street, Robertsbridge TN32 5NR
| Today | See what it's worth now |
| 26 Jun 2025 | £275,000 |
| 20 Aug 2021 | £250,000 |
Harestone, Solomons Lane, Robertsbridge TN32 5LY

| Today | See what it's worth now |
| 11 Jun 2025 | £775,000 |
| 31 Mar 2016 | £445,000 |
Source Acknowledgement: © Crown copyright. England and Wales house price data is publicly available information produced by the HM Land Registry.This material was last updated on 4 February 2026. It covers the period from 1 January 1995 to 24 December 2025 and contains property transactions which have been registered during that period. Contains HM Land Registry data © Crown copyright and database right 2026. This data is licensed under the Open Government Licence v3.0.
Disclaimer: Rightmove.co.uk provides this HM Land Registry data "as is". The burden for fitness of the data relies completely with the user and is provided for informational purposes only. No warranty, express or implied, is given relating to the accuracy of content of the HM Land Registry data and Rightmove does not accept any liability for error or omission. If you have found an error with the data or need further information please contact HM Land Registry.
Permitted Use: Viewers of this Information are granted permission to access this Crown copyright material and to download it onto electronic, magnetic, optical or similar storage media provided that such activities are for private research, study or in-house use only. Any other use of the material requires the formal written permission of Land Registry which can be requested from us, and is subject to an additional licence and associated charge.
Map data ©OpenStreetMap contributors.
Rightmove takes no liability for your use of, or reliance on, Rightmove's Instant Valuation due to the limitations of our tracking tool listed here. Use of this tool is taken entirely at your own risk. All rights reserved.