
House Prices in Huntercombe
House prices in Huntercombe have an overall average of £378,778 over the last year.
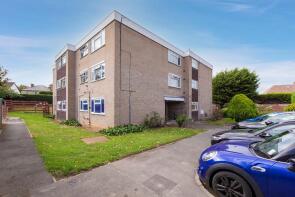
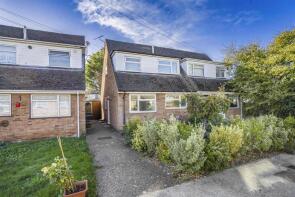
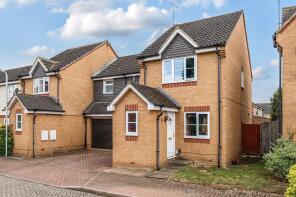
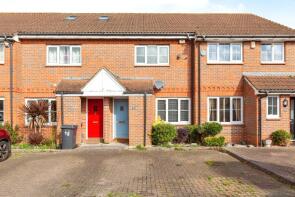
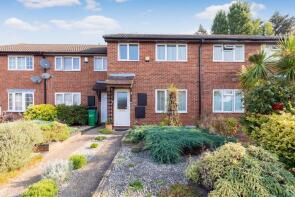
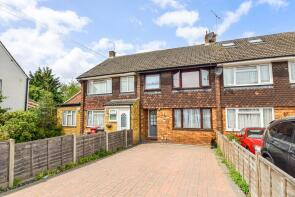
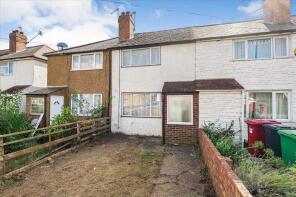
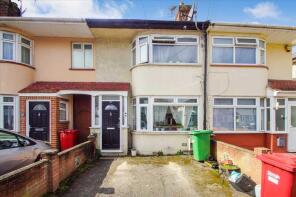
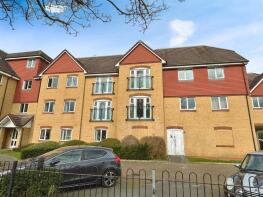
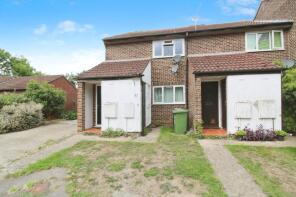
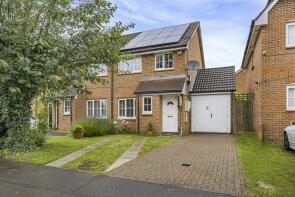
The majority of properties sold in Huntercombe during the last year were semi-detached properties, selling for an average price of £441,422. Terraced properties sold for an average of £381,370, with flats fetching £199,150.
Overall, the historical sold prices in Huntercombe over the last year were 5% down on the previous year and 2% down on the 2023 peak of £387,733.
Properties Sold
46, Fotheringay Gardens, Slough SL1 5SR

| Today | See what it's worth now |
| 27 Mar 2026 | £115,000 |
| 26 Apr 2016 | £105,000 |
19, Mercian Way, Slough SL1 5NA
| Today | See what it's worth now |
| 27 Mar 2026 | £430,500 |
No other historical records.
139, Bower Way, Slough SL1 5HA

| Today | See what it's worth now |
| 13 Mar 2026 | £380,000 |
| 30 Mar 2017 | £320,000 |
6, Lewins Way, Slough SL1 5JQ
| Today | See what it's worth now |
| 13 Mar 2026 | £401,000 |
| 23 Feb 2007 | £204,000 |
No other historical records.
1, Ferrers Close, Slough SL1 5TS

| Today | See what it's worth now |
| 13 Mar 2026 | £515,000 |
| 9 Dec 2011 | £248,500 |
29, Francis Way, Slough SL1 5PJ

| Today | See what it's worth now |
| 6 Mar 2026 | £412,500 |
| 30 Apr 1999 | £104,700 |
No other historical records.
27, Bramber Court, Slough SL1 5SU
| Today | See what it's worth now |
| 27 Feb 2026 | £427,500 |
| 30 Sep 2022 | £375,000 |
23, Warner Close, Slough SL1 5LZ
| Today | See what it's worth now |
| 27 Feb 2026 | £490,000 |
No other historical records.
12, Charlcot Mews, Slough SL1 5HD

| Today | See what it's worth now |
| 27 Feb 2026 | £258,000 |
| 2 Jul 2015 | £209,950 |
46, Boarlands Close, Slough SL1 5DD
| Today | See what it's worth now |
| 23 Feb 2026 | £250,000 |
| 12 May 2017 | £260,000 |
37, Bridge Close, Slough SL1 5JF
| Today | See what it's worth now |
| 11 Feb 2026 | £407,000 |
| 31 Aug 2012 | £206,500 |
No other historical records.
15, Copse Close, Slough SL1 5DT
| Today | See what it's worth now |
| 6 Feb 2026 | £483,000 |
| 23 Apr 2004 | £221,000 |
14, Moor Furlong, Slough SL1 5TL
| Today | See what it's worth now |
| 6 Feb 2026 | £365,000 |
| 18 May 2021 | £318,000 |
43, Dunster Gardens, Slough SL1 5ST
| Today | See what it's worth now |
| 30 Jan 2026 | £418,000 |
| 21 Dec 2016 | £340,000 |
No other historical records.
23, Dennis Way, Slough SL1 5JS
| Today | See what it's worth now |
| 26 Jan 2026 | £490,000 |
| 26 Jun 2006 | £185,000 |
No other historical records.
52, Cippenham Lane, Slough SL1 5BN
| Today | See what it's worth now |
| 23 Jan 2026 | £416,500 |
| 14 Aug 2015 | £281,000 |
63, Dennis Way, Slough SL1 5JS
| Today | See what it's worth now |
| 22 Jan 2026 | £310,000 |
| 14 Nov 2003 | £151,000 |
No other historical records.
11, Lewins Way, Slough SL1 5JQ
| Today | See what it's worth now |
| 21 Jan 2026 | £368,000 |
| 25 Jun 2002 | £125,000 |
21, Charlcot Mews, Slough SL1 5HD
| Today | See what it's worth now |
| 5 Jan 2026 | £237,500 |
| 13 Jun 2016 | £255,000 |
25, Corfe Gardens, Slough SL1 5SX
| Today | See what it's worth now |
| 19 Dec 2025 | £189,000 |
No other historical records.
2, Moor Furlong, Slough SL1 5TL
| Today | See what it's worth now |
| 17 Dec 2025 | £458,500 |
| 8 Sep 2006 | £208,000 |
5, Alder Close, Slough SL1 5DQ

| Today | See what it's worth now |
| 17 Dec 2025 | £256,000 |
| 9 Oct 2015 | £210,000 |
2, The Close, Slough SL1 5PB
| Today | See what it's worth now |
| 16 Dec 2025 | £340,000 |
No other historical records.
Source Acknowledgement: © Crown copyright. England and Wales house price data is publicly available information produced by the HM Land Registry.This material was last updated on 9 July 2026. It covers the period from 1 January 1995 to 30 April 2026 and contains property transactions which have been registered during that period. Contains HM Land Registry data © Crown copyright and database right 2026. This data is licensed under the Open Government Licence v3.0.
Disclaimer: Rightmove.co.uk provides this HM Land Registry data "as is". The burden for fitness of the data relies completely with the user and is provided for informational purposes only. No warranty, express or implied, is given relating to the accuracy of content of the HM Land Registry data and Rightmove does not accept any liability for error or omission. If you have found an error with the data or need further information please contact HM Land Registry.
Permitted Use: Viewers of this Information are granted permission to access this Crown copyright material and to download it onto electronic, magnetic, optical or similar storage media provided that such activities are for private research, study or in-house use only. Any other use of the material requires the formal written permission of Land Registry which can be requested from us, and is subject to an additional licence and associated charge.
Rightmove takes no liability for your use of, or reliance on, Rightmove's Instant Valuation due to the limitations of our tracking tool listed here. Use of this tool is taken entirely at your own risk. All rights reserved.