
House Prices in Colebrook Lane, Loughton, Essex, IG10
House prices in Colebrook Lane have an overall average of £461,500 over the last year.
Overall, the historical sold prices in Colebrook Lane over the last year were 12% up on the previous year and 13% up on the 2022 peak of £410,000.
Properties Sold
195, Colebrook Lane, Loughton IG10 2HG
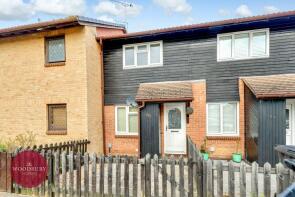
| Today | See what it's worth now |
| 10 Jan 2025 | £400,000 |
| 30 May 2008 | £210,000 |
No other historical records.
76, Colebrook Lane, Loughton IG10 2HN
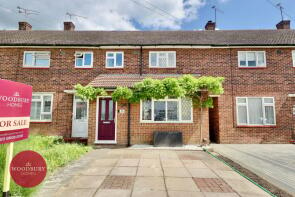
| Today | See what it's worth now |
| 13 Nov 2024 | £523,000 |
| 9 Apr 2021 | £400,000 |
35, Colebrook Lane, Loughton IG10 2HJ

| Today | See what it's worth now |
| 30 Aug 2024 | £412,500 |
| 6 Jun 1996 | £57,600 |
No other historical records.
94, Colebrook Lane, Loughton IG10 2HN
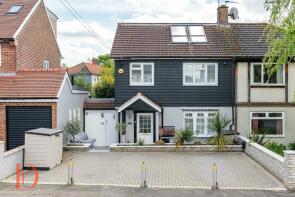
| Today | See what it's worth now |
| 16 Aug 2024 | £670,000 |
| 25 Aug 2017 | £425,000 |
87, Colebrook Lane, Loughton IG10 2HN

| Today | See what it's worth now |
| 16 Apr 2024 | £390,000 |
| 30 Aug 2004 | £113,000 |
No other historical records.
34, Colebrook Lane, Loughton IG10 2HJ
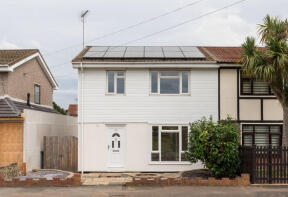
| Today | See what it's worth now |
| 30 Nov 2023 | £395,000 |
| 15 Dec 2006 | £177,000 |
111, Colebrook Lane, Loughton IG10 2HP

| Today | See what it's worth now |
| 20 Nov 2023 | £320,000 |
No other historical records.
233, Colebrook Lane, Loughton IG10 2HG

| Today | See what it's worth now |
| 19 Aug 2023 | £223,000 |
| 30 Jul 2008 | £142,000 |
119, Colebrook Lane, Loughton IG10 2HP

| Today | See what it's worth now |
| 17 Aug 2023 | £470,000 |
| 30 Nov 2009 | £235,000 |
No other historical records.
63a, Colebrook Lane, Loughton IG10 2HN

| Today | See what it's worth now |
| 20 Jan 2023 | £425,000 |
| 13 Aug 2007 | £248,000 |
80, Colebrook Lane, Loughton IG10 2HN

| Today | See what it's worth now |
| 2 Sep 2022 | £435,000 |
| 14 May 2013 | £250,000 |
33, Colebrook Lane, Loughton IG10 2HJ
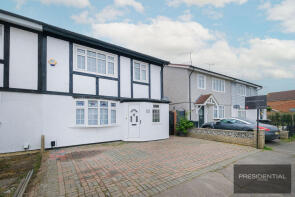
| Today | See what it's worth now |
| 25 Aug 2022 | £475,000 |
| 23 Mar 2009 | £189,000 |
53, Colebrook Lane, Loughton IG10 2HL

| Today | See what it's worth now |
| 25 Aug 2022 | £430,000 |
| 18 Oct 2019 | £385,000 |
36, Colebrook Lane, Loughton IG10 2HJ

| Today | See what it's worth now |
| 18 Aug 2022 | £435,000 |
| 19 Sep 2013 | £249,500 |
197, Colebrook Lane, Loughton IG10 2HG

| Today | See what it's worth now |
| 23 Jun 2022 | £410,000 |
| 12 Apr 2013 | £230,000 |
181, Colebrook Lane, Loughton IG10 2HG

| Today | See what it's worth now |
| 8 Jun 2022 | £225,000 |
| 26 Nov 2014 | £173,500 |
100, Colebrook Lane, Loughton IG10 2HN
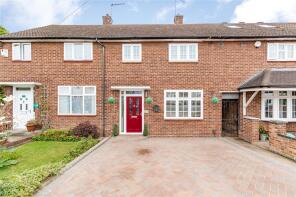
| Today | See what it's worth now |
| 7 Jan 2022 | £460,000 |
| 12 Nov 2010 | �£241,000 |
191, Colebrook Lane, Loughton IG10 2HG
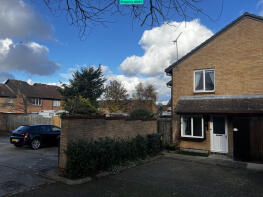
| Today | See what it's worth now |
| 25 Jun 2021 | £275,000 |
No other historical records.
215, Colebrook Lane, Loughton IG10 2HG
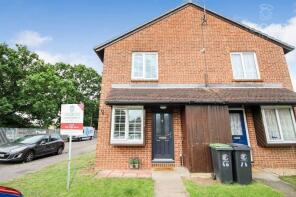
| Today | See what it's worth now |
| 22 Apr 2021 | £275,000 |
| 6 Nov 2018 | £249,000 |
6, Colebrook Lane, Loughton IG10 2HQ

| Today | See what it's worth now |
| 3 Mar 2021 | £410,000 |
| 29 May 2014 | £275,000 |
133, Colebrook Lane, Loughton IG10 2HP

| Today | See what it's worth now |
| 18 Dec 2020 | £320,000 |
| 20 Feb 2014 | £288,000 |
No other historical records.
98, Colebrook Lane, Loughton IG10 2HN
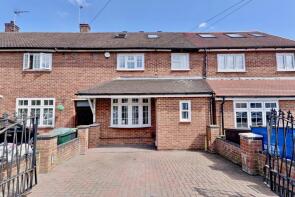
| Today | See what it's worth now |
| 16 Dec 2020 | £435,000 |
| 17 Dec 2014 | £326,500 |
16, Colebrook Lane, Loughton IG10 2HQ

| Today | See what it's worth now |
| 16 Oct 2020 | £345,000 |
| 8 Nov 2013 | £230,000 |
No other historical records.
71, Colebrook Lane, Loughton IG10 2HN

| Today | See what it's worth now |
| 9 Oct 2020 | £415,000 |
No other historical records.
171, Colebrook Lane, Loughton IG10 2HP

| Today | See what it's worth now |
| 2 Oct 2020 | £385,000 |
| 2 Jul 2004 | £175,000 |
No other historical records.
Find out how much your property is worth
The following agents can provide you with a free, no-obligation valuation. Simply select the ones you'd like to hear from.
Sponsored
All featured agents have paid a fee to promote their valuation expertise.

Madison Fox
Loughton

The Good Estate Agent
National

John Thoma Bespoke Estate Agency
Chigwell Branch

Woodbury Homes
Loughton

Daniel Frank Estates
West Essex

Durden & Hunt
Loughton
Get ready with a Mortgage in Principle
- Personalised result in just 20 minutes
- Find out how much you can borrow
- Get viewings faster with agents
- No impact on your credit score
What's your property worth?
Source Acknowledgement: © Crown copyright. England and Wales house price data is publicly available information produced by the HM Land Registry.This material was last updated on 6 August 2025. It covers the period from 1 January 1995 to 30 June 2025 and contains property transactions which have been registered during that period. Contains HM Land Registry data © Crown copyright and database right 2025. This data is licensed under the Open Government Licence v3.0.
Disclaimer: Rightmove.co.uk provides this HM Land Registry data "as is". The burden for fitness of the data relies completely with the user and is provided for informational purposes only. No warranty, express or implied, is given relating to the accuracy of content of the HM Land Registry data and Rightmove does not accept any liability for error or omission. If you have found an error with the data or need further information please contact HM Land Registry.
Permitted Use: Viewers of this Information are granted permission to access this Crown copyright material and to download it onto electronic, magnetic, optical or similar storage media provided that such activities are for private research, study or in-house use only. Any other use of the material requires the formal written permission of Land Registry which can be requested from us, and is subject to an additional licence and associated charge.
Data on planning applications, home extensions and build costs is provided by Resi.co.uk. Planning data is calculated using the last 2 years of residential applications within the selected planning authority. Home extension data, such as build costs and project timelines, are calculated using approximately 9,000 architectural projects Resi has completed, and 23,500 builders quotes submitted via Resi's platform. Build costs are adjusted according to inflation rates to more accurately represent today's prices.
Map data ©OpenStreetMap contributors.
Rightmove takes no liability for your use of, or reliance on, Rightmove's Instant Valuation due to the limitations of our tracking tool listed here. Use of this tool is taken entirely at your own risk. All rights reserved.

