
House Prices in Inverkip
House prices in Inverkip have an overall average of £245,664 over the last year.
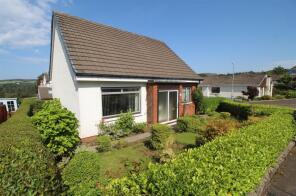
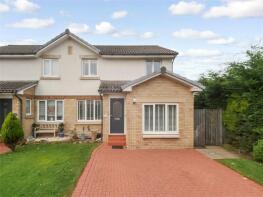
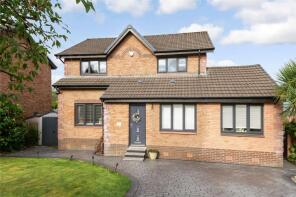
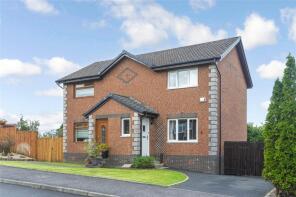
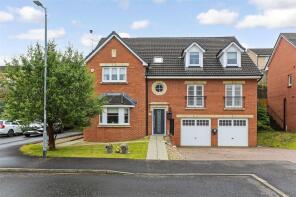
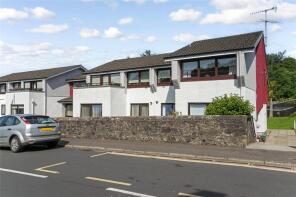
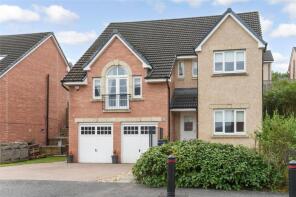
The majority of properties sold in Inverkip during the last year were detached properties, selling for an average price of £333,716. Flats sold for an average of £156,007, with semi-detached properties fetching £189,843.
Overall, the historical sold prices in Inverkip over the last year were 8% up on the previous year and 1% up on the 2022 peak of £242,619.
Properties Sold
2 Marine Court, Main Street, Greenock PA16 0EB

| Today | See what it's worth now |
| 22 Apr 2026 | £120,000 |
| 31 Jan 2019 | £108,525 |
Flat 2-1, 100, Harbourside, Inverkip PA16 0BA
| Today | See what it's worth now |
| 22 Apr 2026 | £190,000 |
| 7 Feb 2011 | £180,000 |
No other historical records.
8, Malin Grove, Greenock PA16 0FF
| Today | See what it's worth now |
| 20 Apr 2026 | £250,000 |
| 7 Dec 2017 | £195,000 |
No other historical records.
24, Findhorn Crescent, Greenock PA16 0FG
| Today | See what it's worth now |
| 13 Apr 2026 | £290,000 |
| 30 May 2005 | £145,000 |
45, Cullen Crescent, Greenock PA16 0HY

| Today | See what it's worth now |
| 9 Apr 2026 | £250,000 |
| 27 Jul 2009 | £150,000 |
No other historical records.
7, Clocherlee Place, Greenock PA16 0FW
| Today | See what it's worth now |
| 8 Apr 2026 | £340,000 |
| 26 Feb 2014 | £220,000 |
No other historical records.
Flat 1, 20, Harbourside, Inverkip PA16 0BF

| Today | See what it's worth now |
| 31 Mar 2026 | £133,000 |
No other historical records.
1 Millhouse Gait, Millhouse Gait, Greenock PA16 0DH
| Today | See what it's worth now |
| 4 Mar 2026 | £400,000 |
| 21 Mar 2011 | £323,067 |
No other historical records.
6, Commoncraig Place, Greenock PA16 0BE
| Today | See what it's worth now |
| 3 Mar 2026 | £480,000 |
| 5 Sep 2023 | £436,500 |
No other historical records.
Ivybank, Main Street, Greenock PA16 0AT
| Today | See what it's worth now |
| 2 Mar 2026 | £112,500 |
| 9 Nov 2018 | £80,000 |
3, Findhorn Road, Inverkip PA16 0HX
| Today | See what it's worth now |
| 20 Feb 2026 | £195,000 |
No other historical records.
2, Crawford Lane, Greenock PA16 0BW
| Today | See what it's worth now |
| 10 Feb 2026 | £165,000 |
| 27 Aug 2021 | £137,777 |
4, Primrose Avenue, Greenock PA16 0DS
| Today | See what it's worth now |
| 10 Feb 2026 | £197,000 |
| 27 Feb 2006 | £146,000 |
No other historical records.
Flat 16, 20, Harbourside, Inverkip PA16 0BF
| Today | See what it's worth now |
| 9 Feb 2026 | £180,000 |
No other historical records.
17, Langhouse Place, Inverkip PA16 0EW

| Today | See what it's worth now |
| 9 Feb 2026 | £255,000 |
No other historical records.
67, Glen Crescent, Greenock PA16 0BP
| Today | See what it's worth now |
| 23 Jan 2026 | £189,000 |
| 16 Jun 2006 | £127,000 |
No other historical records.
3, Kip Avenue, Inverkip PA16 0DX
| Today | See what it's worth now |
| 15 Jan 2026 | £247,650 |
No other historical records.
11, Kinloss Place, Greenock PA16 0HF
| Today | See what it's worth now |
| 15 Jan 2026 | £247,588 |
| 28 Sep 2021 | £210,000 |
17, Aberdour Place, Greenock PA16 0HZ
| Today | See what it's worth now |
| 15 Jan 2026 | £326,800 |
| 30 Oct 2013 | £183,033 |
No other historical records.
43, Cullen Crescent, Greenock PA16 0HY
| Today | See what it's worth now |
| 13 Jan 2026 | £178,000 |
| 10 Aug 2017 | £120,000 |
27, Blaeberry Drive, Greenock PA16 0FS
| Today | See what it's worth now |
| 12 Jan 2026 | £415,000 |
| 10 May 2017 | £342,000 |
No other historical records.
1b, Smithy Court, Main Street, Greenock PA16 0AZ
| Today | See what it's worth now |
| 22 Dec 2025 | £86,000 |
| 24 Apr 2023 | £83,500 |
12 Marine Court, Main Street, Inverkip PA16 0EB
| Today | See what it's worth now |
| 17 Dec 2025 | £105,000 |
No other historical records.
Source Acknowledgement: © Crown copyright. Scottish house price data is publicly available information produced by the Registers of Scotland. Material has been reproduced with the permission of the Keeper of the Registers of Scotland and contains data compiled by Registers of Scotland. For further information, please contact data@ros.gov.uk. Please note the dates shown here relate to the property's registered date not sold date.This material was last updated on 10 July 2026. It covers the period from 8 December 1987 to 30 April 2026 and contains property transactions which have been registered during that period.
Disclaimer: Rightmove.co.uk provides this Registers of Scotland data "as is". The burden for fitness of the data relies completely with the user and is provided for informational purposes only. No warranty, express or implied, is given relating to the accuracy of content of the Registers of Scotland data and Rightmove plc does not accept any liability for error or omission. If you have found an error with the data or need further information please contact data@ros.gov.uk
Permitted Use: The Registers of Scotland allows the reproduction of the data which it provides to Rightmove.co.uk free of charge in any format or medium only for research, private study or for internal circulation within an organisation. This is subject to it being reproduced accurately and not used in a misleading context. The material must be acknowledged as Crown Copyright. You are not allowed to use this information for commercial purposes, nor must you copy, distribute, sell or publish the data in any way. For any other use of this material, please apply to the Registers of Scotland for a licence. You can do this online at www.ros.gov.uk, by email at data@ros.gov.uk or by writing to Business Development, Registers of Scotland, Meadowbank House, 153 London Road, Edinburgh EH8 7AU.
Rightmove takes no liability for your use of, or reliance on, Rightmove's Instant Valuation due to the limitations of our tracking tool listed here. Use of this tool is taken entirely at your own risk. All rights reserved.