
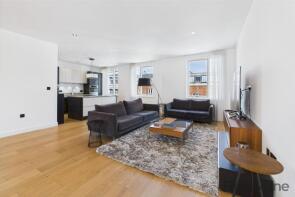
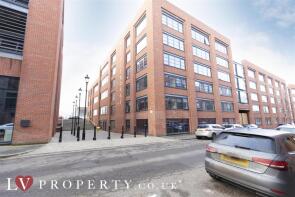
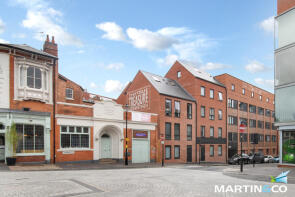
House Prices in Jewellery Quarter
House prices in Jewellery Quarter have an overall average of £205,221 over the last year.
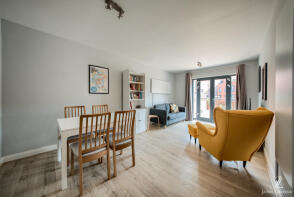
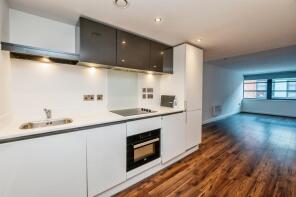
The majority of properties sold in Jewellery Quarter during the last year were flats, selling for an average price of £201,438. Terraced properties sold for an average of £470,000.
Overall, the historical sold prices in Jewellery Quarter over the last year were 21% down on the previous year and 24% down on the 2023 peak of £268,915.
Properties Sold
Apartment 5, 85 St Pauls Chambers, Caroline Street, Birmingham B3 1UP
| Today | See what it's worth now |
| 12 Mar 2026 | £500,000 |
| 7 Jul 2017 | £525,000 |
No other historical records.
Apartment 22, 62 Assay Lofts, Charlotte Street, Birmingham B3 1BP
| Today | See what it's worth now |
| 3 Mar 2026 | £195,000 |
| 16 Dec 2019 | £240,000 |
No other historical records.
Flat 50, 22, Newhall Hill, Birmingham B1 3JA
| Today | See what it's worth now |
| 27 Feb 2026 | £227,000 |
| 1 Sep 2017 | £230,000 |
Flat 55, 22, Newhall Hill, Birmingham B1 3JA
| Today | See what it's worth now |
| 27 Feb 2026 | £410,000 |
| 31 Mar 2017 | £342,000 |
Apartment 228, 126 Kettleworks, Pope Street, Birmingham B1 3DQ
| Today | See what it's worth now |
| 27 Feb 2026 | £200,000 |
| 12 Jul 2019 | £227,500 |
Apartment 7, 2 The Square On The Square, Caroline Street, Birmingham B3 1TR
| Today | See what it's worth now |
| 20 Feb 2026 | £142,000 |
| 4 Jul 2006 | £145,000 |
No other historical records.
Apartment 22, 29 Jewel Court, Legge Lane, Birmingham B1 3LE

| Today | See what it's worth now |
| 12 Feb 2026 | £155,000 |
| 4 Dec 2017 | £174,000 |
No other historical records.
Apartment 240, 126 Kettleworks, Pope Street, Birmingham B1 3DU
| Today | See what it's worth now |
| 6 Feb 2026 | £115,000 |
No other historical records.
Apartment 206, 4, Fleet Street, Birmingham B3 1JH
| Today | See what it's worth now |
| 5 Feb 2026 | £160,000 |
| 18 Mar 2016 | £152,000 |
Apartment 513, 126 Kettleworks, Pope Street, Birmingham B1 3DW
| Today | See what it's worth now |
| 30 Jan 2026 | £172,500 |
| 18 Dec 2018 | £191,950 |
No other historical records.
Apartment 6, 100 Lion Court, Warstone Lane, Birmingham B18 6DZ
| Today | See what it's worth now |
| 9 Jan 2026 | £170,000 |
| 22 Jul 2015 | £168,000 |
82, Newhall Court, Birmingham B3 1DR
| Today | See what it's worth now |
| 8 Jan 2026 | £236,000 |
| 10 Mar 2023 | £265,000 |
Apartment 5, 65, Graham Street, Ladywood, Birmingham B1 3JR

| Today | See what it's worth now |
| 19 Dec 2025 | £223,000 |
| 26 Apr 2002 | £180,500 |
No other historical records.
Apartment 2, 61 Miller, St Pauls Square, Birmingham B3 1QS

| Today | See what it's worth now |
| 17 Dec 2025 | £204,500 |
| 29 Mar 2019 | £196,000 |
Flat 15, St Pauls Mews, St Pauls Square, Birmingham B3 1RB
| Today | See what it's worth now |
| 12 Dec 2025 | £88,000 |
| 4 Apr 2014 | £85,000 |
Apartment 408, 6, Fleet Street, Birmingham B3 1JH
| Today | See what it's worth now |
| 1 Dec 2025 | £178,000 |
| 30 Jun 2004 | £173,000 |
No other historical records.
Flat 6, 70, Branston Street, Birmingham B18 6BP

| Today | See what it's worth now |
| 28 Nov 2025 | £213,500 |
| 13 Nov 2020 | £185,000 |
Apartment 405, 126 Kettleworks, Pope Street, Birmingham B1 3DW
| Today | See what it's worth now |
| 28 Nov 2025 | £158,000 |
| 19 Jun 2020 | £186,500 |
321, Amazon Lofts, Tenby Street, Birmingham B1 3AJ
| Today | See what it's worth now |
| 26 Nov 2025 | £143,000 |
| 13 Apr 2017 | £173,000 |
93, Camden Street, Ladywood, Birmingham B1 3DD
| Today | See what it's worth now |
| 24 Nov 2025 | £470,000 |
| 3 Aug 2017 | £357,000 |
17, 54a Old Silver Works, Spencer Street, Birmingham B18 6JT

| Today | See what it's worth now |
| 19 Nov 2025 | £147,000 |
| 28 Sep 2007 | £115,000 |
Apartment 104, 10 Moreton House, Moreton Street, Birmingham B1 3BE
| Today | See what it's worth now |
| 14 Nov 2025 | £145,000 |
| 17 Dec 2019 | £179,950 |
No other historical records.
Penthouse 2, Millennium Apartments, Newhall Street, Birmingham B3 1BA
| Today | See what it's worth now |
| 14 Nov 2025 | £225,000 |
No other historical records.
Source Acknowledgement: © Crown copyright. England and Wales house price data is publicly available information produced by the HM Land Registry.This material was last updated on 15 May 2026. It covers the period from 1 January 1995 to 31 March 2026 and contains property transactions which have been registered during that period. Contains HM Land Registry data © Crown copyright and database right 2026. This data is licensed under the Open Government Licence v3.0.
Disclaimer: Rightmove.co.uk provides this HM Land Registry data "as is". The burden for fitness of the data relies completely with the user and is provided for informational purposes only. No warranty, express or implied, is given relating to the accuracy of content of the HM Land Registry data and Rightmove does not accept any liability for error or omission. If you have found an error with the data or need further information please contact HM Land Registry.
Permitted Use: Viewers of this Information are granted permission to access this Crown copyright material and to download it onto electronic, magnetic, optical or similar storage media provided that such activities are for private research, study or in-house use only. Any other use of the material requires the formal written permission of Land Registry which can be requested from us, and is subject to an additional licence and associated charge.
Map data ©OpenStreetMap contributors.
Rightmove takes no liability for your use of, or reliance on, Rightmove's Instant Valuation due to the limitations of our tracking tool listed here. Use of this tool is taken entirely at your own risk. All rights reserved.