
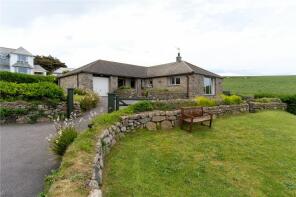
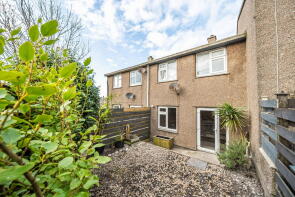
House Prices in Kelynack
House prices in Kelynack have an overall average of £276,598 over the last year.
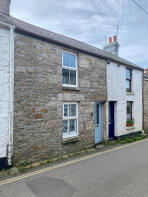
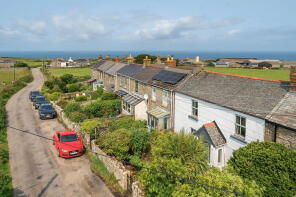
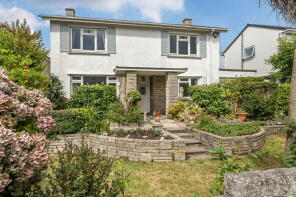
The majority of properties sold in Kelynack during the last year were terraced properties, selling for an average price of £237,768. Detached properties sold for an average of £378,748, with semi-detached properties fetching £351,667.
Overall, the historical sold prices in Kelynack over the last year were 22% down on the previous year and 18% down on the 2023 peak of £339,224.
Properties Sold
36, Talveneth, Penzance TR19 7UT

| Today | See what it's worth now |
| 1 Apr 2026 | £200,000 |
| 26 Mar 2021 | £167,000 |
Sea Breezes, Botallack, St Just TR19 7QG
| Today | See what it's worth now |
| 23 Mar 2026 | £255,000 |
| 10 Mar 2021 | £220,000 |
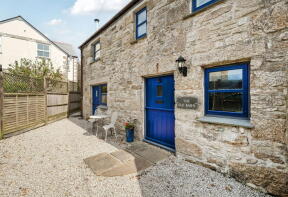
The Old Barn, Trelew Gardens, Penzance TR19 7JE
| Today | See what it's worth now |
| 27 Feb 2026 | £245,000 |
| 30 Oct 2020 | £217,500 |
2, Calartha Terrace, B3306 Between St Ives Road And St Johns Terrace, Boscaswell Downs, Penzance TR19 7DX
| Today | See what it's worth now |
| 19 Feb 2026 | £187,000 |
| 21 Aug 2020 | £140,000 |
37, Talveneth, Penzance TR19 7UT
| Today | See what it's worth now |
| 21 Jan 2026 | £197,500 |
| 12 May 2022 | £186,000 |
16, Hillside Cottages, Trewellard, Pendeen TR19 7SS
| Today | See what it's worth now |
| 15 Jan 2026 | £590,000 |
No other historical records.
8, Calartha Terrace, B3306 Between St Ives Road And St Johns Terrace, Boscaswell Downs, Penzance TR19 7DX

| Today | See what it's worth now |
| 7 Jan 2026 | £280,000 |
| 18 Dec 2020 | £215,000 |
9, St Johns Terrace, Pendeen TR19 7DP

| Today | See what it's worth now |
| 22 Dec 2025 | £140,000 |
No other historical records.
31a, Bosorne Road, Penzance TR19 7JH
| Today | See what it's worth now |
| 16 Dec 2025 | £150,000 |
| 1 Nov 2002 | £85,000 |
21, South Place, Penzance TR19 7HW
| Today | See what it's worth now |
| 9 Dec 2025 | £325,000 |
| 10 Mar 2006 | £195,000 |
Skylark, Crescent Place, B3306 Between St Johns Terrace And Geevor Mine, Pendeen TR19 7SJ

| Today | See what it's worth now |
| 20 Nov 2025 | £210,000 |
No other historical records.
Lowarn, Boscaswell Downs, Pendeen TR19 7DR
| Today | See what it's worth now |
| 18 Nov 2025 | £382,500 |
No other historical records.
5 Rose Cottage, B3306 Between Carnyorth Terrace And Parc An Yorth, Carnyorth, Penzance TR19 7QD
| Today | See what it's worth now |
| 13 Nov 2025 | £170,000 |
| 22 Oct 2001 | £70,000 |
Goldings, Cape Cornwall Street, St. Just, St Just TR19 7JX
| Today | See what it's worth now |
| 3 Nov 2025 | £535,000 |
No other historical records.
36, Boscaswell Village, Penzance TR19 7EP
| Today | See what it's worth now |
| 29 Oct 2025 | £215,000 |
| 29 Mar 2021 | £171,000 |
5, Moorland Close, Lower Boscaswell, Penzance TR19 7EF
| Today | See what it's worth now |
| 29 Oct 2025 | £225,000 |
| 24 Jun 2011 | £140,000 |
No other historical records.
Wayside, A3071 From Lafrowda Common To Carn Bosavern, Higher Bosavern, Penzance TR19 7QY
| Today | See what it's worth now |
| 29 Oct 2025 | £250,000 |
| 2 Feb 2024 | £320,000 |
No other historical records.
3, Boswedden Road, St. Just, St Just TR19 7JT
| Today | See what it's worth now |
| 27 Oct 2025 | £200,000 |
No other historical records.
The Pad, Botallack Moor, Botallack, Penzance TR19 7QH
| Today | See what it's worth now |
| 17 Oct 2025 | £301,230 |
| 8 Jun 2001 | £84,000 |
No other historical records.
8, Boscaswell Terrace, Penzance TR19 7DS
| Today | See what it's worth now |
| 17 Oct 2025 | £225,000 |
| 5 May 2017 | £155,000 |
Upton Lodge, Cove Road, Penzance TR19 7BT
| Today | See what it's worth now |
| 16 Oct 2025 | £375,000 |
| 16 Apr 1997 | £145,000 |
No other historical records.
8, Bosorne Road, Penzance TR19 7JL
| Today | See what it's worth now |
| 15 Oct 2025 | £185,000 |
| 14 Mar 2018 | £126,000 |
14, Levant Road, Trewellard, Penzance TR19 7SU
| Today | See what it's worth now |
| 10 Oct 2025 | £350,000 |
| 14 Dec 2001 | £99,950 |
Source Acknowledgement: © Crown copyright. England and Wales house price data is publicly available information produced by the HM Land Registry.This material was last updated on 9 July 2026. It covers the period from 1 January 1995 to 30 April 2026 and contains property transactions which have been registered during that period. Contains HM Land Registry data © Crown copyright and database right 2026. This data is licensed under the Open Government Licence v3.0.
Disclaimer: Rightmove.co.uk provides this HM Land Registry data "as is". The burden for fitness of the data relies completely with the user and is provided for informational purposes only. No warranty, express or implied, is given relating to the accuracy of content of the HM Land Registry data and Rightmove does not accept any liability for error or omission. If you have found an error with the data or need further information please contact HM Land Registry.
Permitted Use: Viewers of this Information are granted permission to access this Crown copyright material and to download it onto electronic, magnetic, optical or similar storage media provided that such activities are for private research, study or in-house use only. Any other use of the material requires the formal written permission of Land Registry which can be requested from us, and is subject to an additional licence and associated charge.
Rightmove takes no liability for your use of, or reliance on, Rightmove's Instant Valuation due to the limitations of our tracking tool listed here. Use of this tool is taken entirely at your own risk. All rights reserved.