
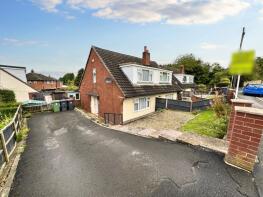
House Prices in Ketley
House prices in Ketley have an overall average of £195,032 over the last year.
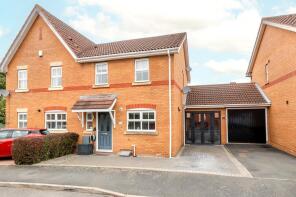
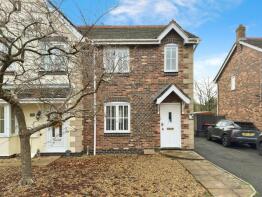
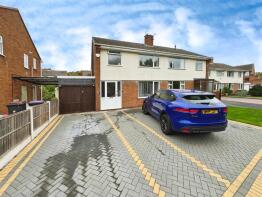
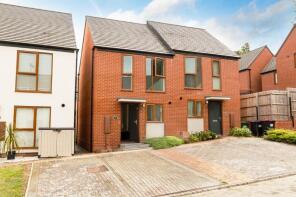
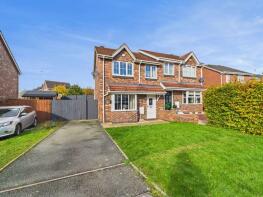
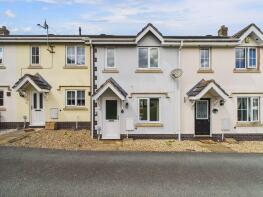
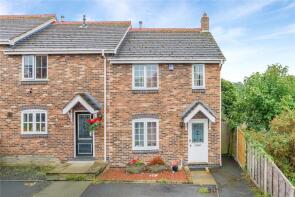
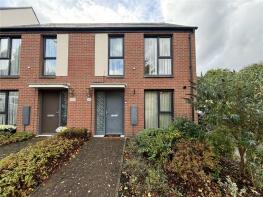
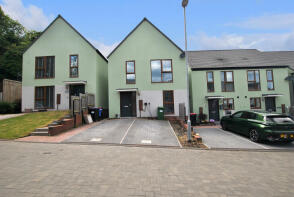
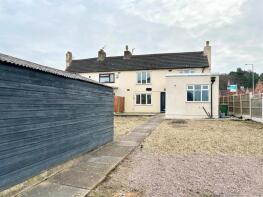
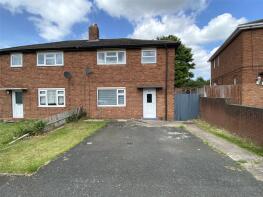
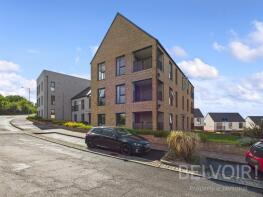
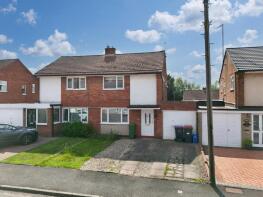
The majority of properties sold in Ketley during the last year were semi-detached properties, selling for an average price of £182,924. Detached properties sold for an average of £267,714, with terraced properties fetching £221,542.
Overall, the historical sold prices in Ketley over the last year were 4% up on the previous year and 3% up on the 2023 peak of £189,801.
Properties Sold
31, Ivy House Paddocks, Ketley, Telford TF1 5GD
| Today | See what it's worth now |
| 1 Apr 2026 | £215,000 |
| 6 Aug 2018 | £145,000 |
5, Buttonwood Glade, Ketley, Telford TF1 5ZJ
| Today | See what it's worth now |
| 20 Mar 2026 | £182,000 |
| 23 Sep 2005 | £132,000 |
25, Orchard Close, Ketley, Telford TF1 5HA
| Today | See what it's worth now |
| 20 Mar 2026 | £210,000 |
| 27 Aug 2021 | £172,500 |
35, Oak Trees Avenue, Ketley, Telford TF1 5FR
| Today | See what it's worth now |
| 4 Mar 2026 | £177,000 |
| 19 Jun 2020 | £145,950 |
No other historical records.
48, Cornflower Grove, Ketley, Telford TF1 5ZH
| Today | See what it's worth now |
| 30 Jan 2026 | £209,000 |
| 3 Mar 2015 | £147,000 |
37, Cornflower Grove, Ketley, Telford TF1 5ZH
| Today | See what it's worth now |
| 30 Jan 2026 | £163,000 |
| 24 Apr 2020 | £125,000 |
8, Buttonwood Glade, Ketley, Telford TF1 5ZJ
| Today | See what it's worth now |
| 23 Jan 2026 | £185,000 |
| 11 Oct 2004 | £120,000 |
147, Ketley Park Road, Ketley, Telford TF1 5FF
| Today | See what it's worth now |
| 19 Dec 2025 | £110,000 |
| 17 Dec 2020 | £83,000 |
No other historical records.
37, Ivy House Paddocks, Ketley, Telford TF1 5GD

| Today | See what it's worth now |
| 18 Dec 2025 | £235,000 |
| 19 Aug 2020 | £180,000 |
30, Oak Trees Avenue, Ketley, Telford TF1 5FR
| Today | See what it's worth now |
| 18 Dec 2025 | £280,000 |
| 25 Sep 2020 | £224,496 |
No other historical records.
65 Pleasant View, Holyhead Road, Ketley, Telford TF1 5AN
| Today | See what it's worth now |
| 18 Dec 2025 | £163,000 |
| 28 Mar 2003 | £30,000 |
No other historical records.
14, Wedgewood Crescent, Ketley, Telford TF1 5BH
| Today | See what it's worth now |
| 17 Dec 2025 | £185,000 |
| 17 Aug 2007 | £119,950 |
69, Parkside Crescent, Ketley, Telford TF1 5GT
| Today | See what it's worth now |
| 1 Dec 2025 | £139,000 |
| 22 Nov 2019 | £116,000 |
No other historical records.
53, Parkside Crescent, Ketley, Telford TF1 5GT

| Today | See what it's worth now |
| 28 Nov 2025 | £142,500 |
| 28 Jun 2019 | £123,495 |
No other historical records.
8, Copper Beech Road, Ketley, Telford TF1 5BQ
| Today | See what it's worth now |
| 28 Nov 2025 | £150,000 |
| 7 Jul 2004 | £99,950 |
No other historical records.
12a, Orchard Close, Ketley, Telford TF1 5HA
| Today | See what it's worth now |
| 26 Nov 2025 | £210,000 |
| 8 Jun 2001 | £56,000 |
39, Woodside Road, Ketley, Telford TF1 5HB
| Today | See what it's worth now |
| 25 Nov 2025 | £190,000 |
| 13 Apr 2017 | £132,000 |
5, Staneford Close, Ketley, Telford TF1 5GS
| Today | See what it's worth now |
| 21 Nov 2025 | £134,000 |
| 8 Jan 2025 | £129,950 |
1, Parkside Crescent, Ketley, Telford TF1 5GT
| Today | See what it's worth now |
| 19 Nov 2025 | £140,000 |
| 20 Dec 2018 | £114,995 |
No other historical records.
18, Woodside Road, Ketley, Telford TF1 5HB
| Today | See what it's worth now |
| 14 Nov 2025 | £215,000 |
| 31 Jan 2023 | £170,000 |
No other historical records.
48, Ketley Park Road, Ketley, Telford TF1 5BF
| Today | See what it's worth now |
| 12 Nov 2025 | £105,000 |
| 30 Jun 2020 | £70,000 |
No other historical records.
18, Castle View, Red Lake, Telford TF1 5EN

| Today | See what it's worth now |
| 7 Nov 2025 | £215,000 |
| 4 Jun 2020 | £163,000 |
28, Sinclair Gardens, Ketley, Telford TF1 5HP
| Today | See what it's worth now |
| 28 Oct 2025 | £300,000 |
| 25 Jun 1999 | £41,000 |
No other historical records.
Source Acknowledgement: © Crown copyright. England and Wales house price data is publicly available information produced by the HM Land Registry.This material was last updated on 9 July 2026. It covers the period from 1 January 1995 to 30 April 2026 and contains property transactions which have been registered during that period. Contains HM Land Registry data © Crown copyright and database right 2026. This data is licensed under the Open Government Licence v3.0.
Disclaimer: Rightmove.co.uk provides this HM Land Registry data "as is". The burden for fitness of the data relies completely with the user and is provided for informational purposes only. No warranty, express or implied, is given relating to the accuracy of content of the HM Land Registry data and Rightmove does not accept any liability for error or omission. If you have found an error with the data or need further information please contact HM Land Registry.
Permitted Use: Viewers of this Information are granted permission to access this Crown copyright material and to download it onto electronic, magnetic, optical or similar storage media provided that such activities are for private research, study or in-house use only. Any other use of the material requires the formal written permission of Land Registry which can be requested from us, and is subject to an additional licence and associated charge.
Rightmove takes no liability for your use of, or reliance on, Rightmove's Instant Valuation due to the limitations of our tracking tool listed here. Use of this tool is taken entirely at your own risk. All rights reserved.