
House Prices in Kettlesing Head
House prices in Kettlesing Head have an overall average of £343,823 over the last year.
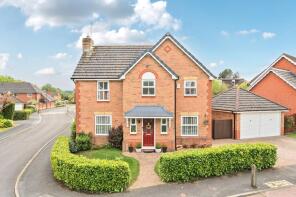
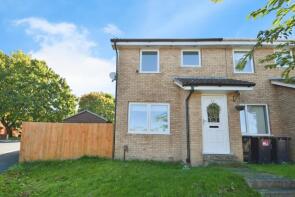
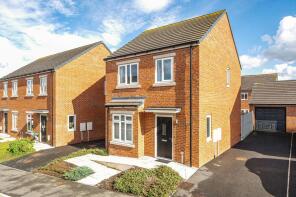
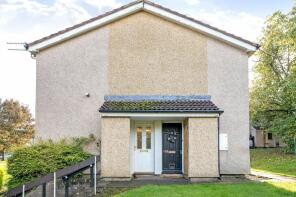
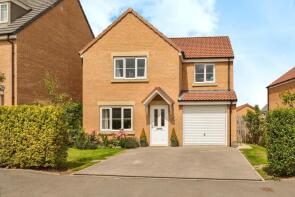
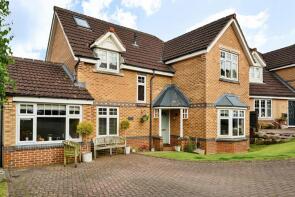
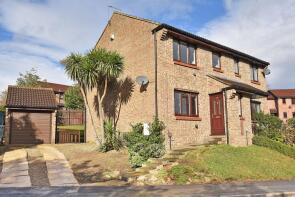
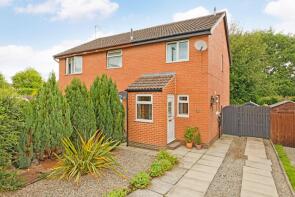
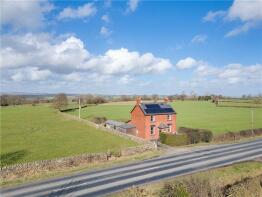
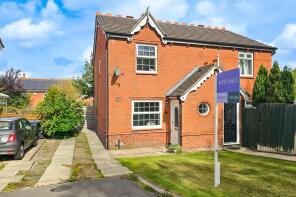
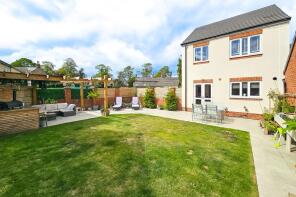
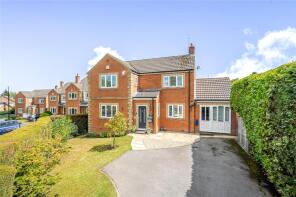
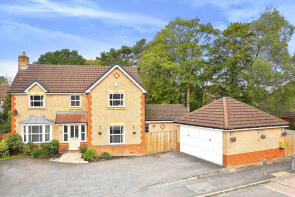
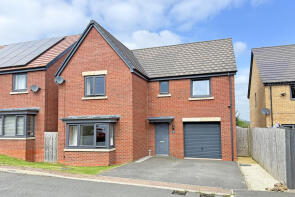
The majority of properties sold in Kettlesing Head during the last year were detached properties, selling for an average price of £478,294. Semi-detached properties sold for an average of £262,118, with terraced properties fetching £222,950.
Overall, the historical sold prices in Kettlesing Head over the last year were 12% down on the previous year and 18% down on the 2023 peak of £418,959.
Properties Sold
7, Long Crag View, Harrogate HG3 2GJ
| Today | See what it's worth now |
| 20 Mar 2026 | £575,000 |
| 19 Dec 2014 | £377,000 |
48, Markenfield Road, Harrogate HG3 2TR
| Today | See what it's worth now |
| 20 Mar 2026 | £164,000 |
| 21 Nov 2018 | £136,500 |
2, Thomas Drive, Harrogate HG3 2FA
| Today | See what it's worth now |
| 16 Mar 2026 | £318,000 |
| 28 Jan 2022 | £320,000 |
No other historical records.
168, Newby Crescent, Harrogate HG3 2TU
| Today | See what it's worth now |
| 10 Mar 2026 | £128,000 |
| 6 Apr 2020 | £93,750 |
63, Ribblehead Road, Harrogate HG3 2HD
| Today | See what it's worth now |
| 4 Mar 2026 | £390,000 |
| 11 Dec 2020 | £345,000 |
No other historical records.
1, Cornflower Way, Harrogate HG3 2WL
| Today | See what it's worth now |
| 27 Feb 2026 | £497,000 |
| 21 Jul 2000 | £125,995 |
No other historical records.
13, Hartwith Close, Harrogate HG3 2XW
| Today | See what it's worth now |
| 27 Feb 2026 | £260,000 |
| 31 Oct 2003 | £125,000 |
38, Butterbur Way, Harrogate HG3 2XH
| Today | See what it's worth now |
| 27 Feb 2026 | £218,000 |
| 3 Aug 2001 | £74,000 |
No other historical records.
Walton House, Skipton Road, Harrogate HG3 2LZ
| Today | See what it's worth now |
| 26 Feb 2026 | £444,000 |
| 30 Nov 2009 | £225,000 |
No other historical records.
21, Bluebell Meadow, Harrogate HG3 2HF
| Today | See what it's worth now |
| 26 Feb 2026 | £245,000 |
| 14 Dec 2012 | £184,000 |
25, Hartwith Drive, Harrogate HG3 2XN

| Today | See what it's worth now |
| 23 Feb 2026 | £263,000 |
| 31 Dec 1996 | £56,000 |
No other historical records.
76, Fewston Drive, Harrogate HG3 2FH
| Today | See what it's worth now |
| 20 Feb 2026 | £118,000 |
No other historical records.
5, Nidd Orchard, Harrogate HG3 2PE
| Today | See what it's worth now |
| 20 Feb 2026 | £550,000 |
| 16 Nov 2017 | £429,950 |
17, Larkspur Grove, Harrogate HG3 2YA
| Today | See what it's worth now |
| 19 Feb 2026 | £250,000 |
| 19 Mar 2004 | £154,000 |
48, Thomas Drive, Harrogate HG3 2FA
| Today | See what it's worth now |
| 18 Feb 2026 | £355,000 |
| 6 Jul 2022 | £347,500 |
23 Langdale House, Saltergate Drive, Harrogate HG3 2YE
| Today | See what it's worth now |
| 10 Feb 2026 | £480,000 |
| 3 Apr 2018 | £385,000 |
No other historical records.
11, Youngs Drive, Harrogate HG3 2GA
| Today | See what it's worth now |
| 6 Feb 2026 | £700,000 |
| 22 Oct 2012 | £485,000 |
50, Cautley Drive, Harrogate HG3 2DJ
| Today | See what it's worth now |
| 6 Feb 2026 | £457,000 |
| 22 Jun 2018 | £449,950 |
No other historical records.
36, Truro Crescent, Harrogate HG3 2TE
| Today | See what it's worth now |
| 6 Feb 2026 | £171,000 |
| 7 Dec 2004 | £128,750 |
No other historical records.
199, Saltergate Drive, Harrogate HG3 2XZ

| Today | See what it's worth now |
| 6 Feb 2026 | £350,000 |
| 1 Nov 2013 | £243,000 |
11, Blackstone Chase, Harrogate HG3 2NW

| Today | See what it's worth now |
| 30 Jan 2026 | £75,000 |
No other historical records.
Stumps View, Darley HG3 2PR
| Today | See what it's worth now |
| 26 Jan 2026 | £415,000 |
No other historical records.
19, Fewston Drive, Harrogate HG3 2FH
| Today | See what it's worth now |
| 23 Jan 2026 | £258,000 |
| 8 Aug 2022 | £282,500 |
No other historical records.

Source Acknowledgement: © Crown copyright. England and Wales house price data is publicly available information produced by the HM Land Registry.This material was last updated on 15 May 2026. It covers the period from 1 January 1995 to 31 March 2026 and contains property transactions which have been registered during that period. Contains HM Land Registry data © Crown copyright and database right 2026. This data is licensed under the Open Government Licence v3.0.
Disclaimer: Rightmove.co.uk provides this HM Land Registry data "as is". The burden for fitness of the data relies completely with the user and is provided for informational purposes only. No warranty, express or implied, is given relating to the accuracy of content of the HM Land Registry data and Rightmove does not accept any liability for error or omission. If you have found an error with the data or need further information please contact HM Land Registry.
Permitted Use: Viewers of this Information are granted permission to access this Crown copyright material and to download it onto electronic, magnetic, optical or similar storage media provided that such activities are for private research, study or in-house use only. Any other use of the material requires the formal written permission of Land Registry which can be requested from us, and is subject to an additional licence and associated charge.
Rightmove takes no liability for your use of, or reliance on, Rightmove's Instant Valuation due to the limitations of our tracking tool listed here. Use of this tool is taken entirely at your own risk. All rights reserved.