
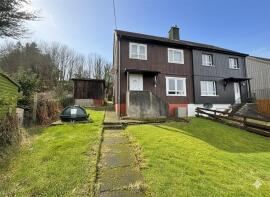
House Prices in Killinochonoch
House prices in Killinochonoch have an overall average of £203,279 over the last year.
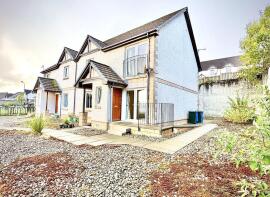
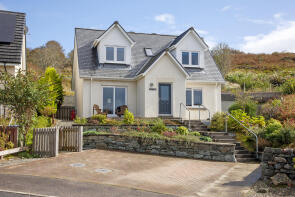
The majority of properties sold in Killinochonoch during the last year were detached properties, selling for an average price of £310,742. Semi-detached properties sold for an average of £154,498, with flats fetching £92,853.
Overall, the historical sold prices in Killinochonoch over the last year were 7% up on the previous year and 3% down on the 2022 peak of £209,734.
Properties Sold
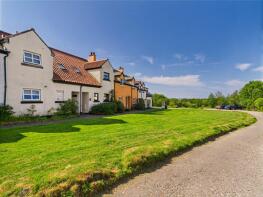
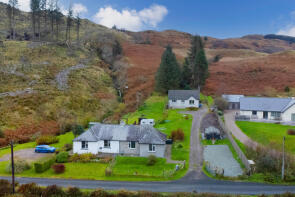
27, The Green, Craobh Haven PA31 8UB
| Today | See what it's worth now |
| 27 Apr 2026 | £180,000 |
No other historical records.
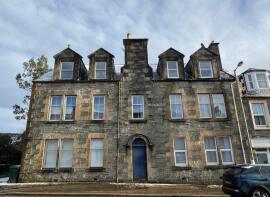
Flat 2/2, Clydesdale Buildings, Argyll Street, Lochgilphead PA31 8NE
| Today | See what it's worth now |
| 27 Apr 2026 | £52,500 |
No other historical records.
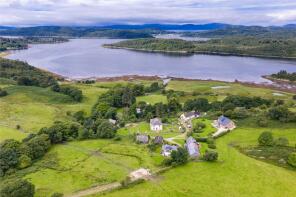
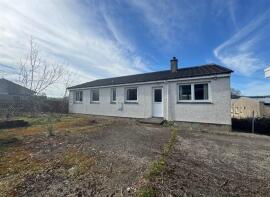
Barbrae House, Bellanoch PA31 8SN

| Today | See what it's worth now |
| 22 Apr 2026 | £265,000 |
No other historical records.
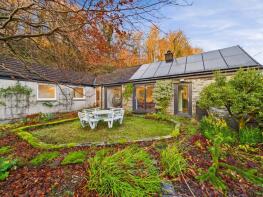
Kilmichael Inverlussa, Achnamara PA31 8PX
| Today | See what it's worth now |
| 17 Apr 2026 | £158,460 |
| 14 Jul 2023 | £260,000 |
No other historical records.
Ballibrad, Track From A816 At Kilmartin To Number 26 Kilmartin, Lochgilphead PA31 8RN

| Today | See what it's worth now |
| 14 Apr 2026 | £90,000 |
| 9 Oct 2023 | £235,000 |
No other historical records.
Calton Duin, Kilmartin, Slockavullin PA31 8QG
| Today | See what it's worth now |
| 13 Apr 2026 | £275,000 |
| 14 Jan 2021 | £198,000 |
No other historical records.
25, Fernoch Park, Lochgilphead PA31 8TG

| Today | See what it's worth now |
| 13 Apr 2026 | £250,000 |
No other historical records.
Flat 3, 4, Poltalloch Street, Lochgilphead PA31 8LP
| Today | See what it's worth now |
| 8 Apr 2026 | £50,000 |
No other historical records.
21, C42 Through Achnamara, Achnamara PA31 8PU
| Today | See what it's worth now |
| 6 Apr 2026 | £212,000 |
No other historical records.
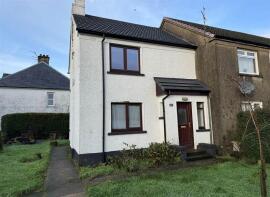
3, Kirklena, Hillview Terrace, Ardrishaig PA30 8HB
| Today | See what it's worth now |
| 3 Apr 2026 | £125,000 |
No other historical records.
6, Port Ann Housing Access Road, Port Ann PA31 8SE

| Today | See what it's worth now |
| 3 Apr 2026 | £70,000 |
| 14 May 2018 | £120,000 |
5, Fernoch Crescent, Lochgilphead PA31 8AE
| Today | See what it's worth now |
| 2 Apr 2026 | £310,000 |
No other historical records.
1 Mount Pleasant, Manse Brae, Lochgilphead PA31 8RA
| Today | See what it's worth now |
| 1 Apr 2026 | £240,000 |
No other historical records.
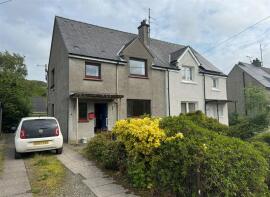
3, Hillview Terrace, Ardrishaig PA30 8EL
| Today | See what it's worth now |
| 30 Mar 2026 | £105,000 |
No other historical records.
26, St Clair Way, Lochgilphead PA30 8FB
| Today | See what it's worth now |
| 30 Mar 2026 | £120,000 |
| 27 Oct 2004 | £76,000 |
No other historical records.
2, Torr Mor Road, Lochgilphead PA31 8AQ
| Today | See what it's worth now |
| 24 Mar 2026 | £340,000 |
| 25 Sep 2020 | £237,900 |
No other historical records.
6, Stag Park, Lochgilphead PA31 8NU
| Today | See what it's worth now |
| 23 Mar 2026 | £130,000 |
| 31 Mar 2021 | £68,000 |
2 Pier Cottage, Ford PA31 8RH
| Today | See what it's worth now |
| 23 Mar 2026 | £185,000 |
No other historical records.
29, Brodie Crescent, Lochgilphead PA31 8NW
| Today | See what it's worth now |
| 20 Mar 2026 | £87,000 |
| 4 Dec 2012 | £62,000 |
2, Stag Park Court, Lochgilphead PA31 8JQ
| Today | See what it's worth now |
| 18 Mar 2026 | £81,000 |
No other historical records.
48, Brodie Crescent, Lochgilphead PA31 8NW
| Today | See what it's worth now |
| 16 Mar 2026 | £98,000 |
| 15 Aug 2022 | £108,000 |
No other historical records.
7, Kilmory Road, Lochgilphead PA31 8SZ
| Today | See what it's worth now |
| 11 Mar 2026 | £175,000 |
No other historical records.
1, Bank Park, Lochgilphead PA31 8NX

| Today | See what it's worth now |
| 10 Mar 2026 | £100,000 |
No other historical records.
Source Acknowledgement: © Crown copyright. Scottish house price data is publicly available information produced by the Registers of Scotland. Material has been reproduced with the permission of the Keeper of the Registers of Scotland and contains data compiled by Registers of Scotland. For further information, please contact data@ros.gov.uk. Please note the dates shown here relate to the property's registered date not sold date.This material was last updated on 10 July 2026. It covers the period from 8 December 1987 to 30 April 2026 and contains property transactions which have been registered during that period.
Disclaimer: Rightmove.co.uk provides this Registers of Scotland data "as is". The burden for fitness of the data relies completely with the user and is provided for informational purposes only. No warranty, express or implied, is given relating to the accuracy of content of the Registers of Scotland data and Rightmove plc does not accept any liability for error or omission. If you have found an error with the data or need further information please contact data@ros.gov.uk
Permitted Use: The Registers of Scotland allows the reproduction of the data which it provides to Rightmove.co.uk free of charge in any format or medium only for research, private study or for internal circulation within an organisation. This is subject to it being reproduced accurately and not used in a misleading context. The material must be acknowledged as Crown Copyright. You are not allowed to use this information for commercial purposes, nor must you copy, distribute, sell or publish the data in any way. For any other use of this material, please apply to the Registers of Scotland for a licence. You can do this online at www.ros.gov.uk, by email at data@ros.gov.uk or by writing to Business Development, Registers of Scotland, Meadowbank House, 153 London Road, Edinburgh EH8 7AU.
Rightmove takes no liability for your use of, or reliance on, Rightmove's Instant Valuation due to the limitations of our tracking tool listed here. Use of this tool is taken entirely at your own risk. All rights reserved.