
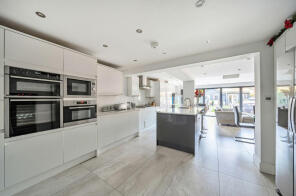
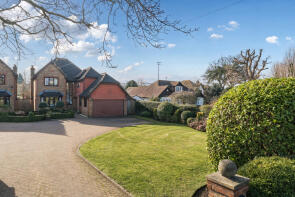
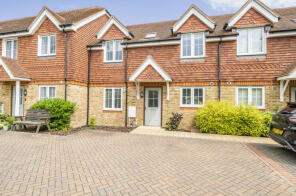
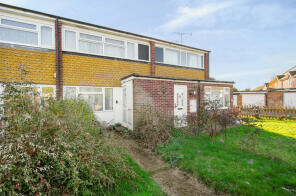
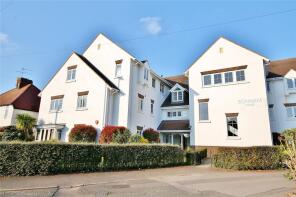
House Prices in Kingfield
House prices in Kingfield have an overall average of £487,083 over the last year.
The majority of properties sold in Kingfield during the last year were semi-detached properties, selling for an average price of £512,500. Detached properties sold for an average of £563,750, with flats fetching £250,000.
Overall, the historical sold prices in Kingfield over the last year were 4% down on the previous year and 6% down on the 2022 peak of £518,930.
Properties Sold
1, Poplar Cottage, Stockers Lane, Kingfield, Woking GU22 9DB
| Today | See what it's worth now |
| 21 Apr 2026 | £535,000 |
| 30 Sep 2020 | £495,950 |
27, Queen Elizabeth Way, Kingfield, Woking GU22 9AG
| Today | See what it's worth now |
| 31 Mar 2026 | £520,000 |
| 10 Sep 2020 | £400,000 |
No other historical records.
40, Howards Road, Kingfield, Woking GU22 9AS
| Today | See what it's worth now |
| 25 Mar 2026 | £460,000 |
| 17 Sep 2021 | £450,000 |
6, Kingfield Drive, Kingfield, Woking GU22 9AD
| Today | See what it's worth now |
| 13 Feb 2026 | £260,000 |
| 31 May 2023 | £275,000 |
64, Elmbridge Lane, Kingfield, Woking GU22 9AW
| Today | See what it's worth now |
| 30 Jan 2026 | £640,000 |
| 19 Apr 2004 | £159,500 |
No other historical records.
The Ridings, Kingfield Road, Kingfield, Woking GU22 9AB
| Today | See what it's worth now |
| 9 Jan 2026 | £602,500 |
| 13 May 2016 | £535,000 |
30, Stockers Lane, Kingfield, Woking GU22 9DB

| Today | See what it's worth now |
| 3 Oct 2025 | £685,000 |
No other historical records.
51, Stockers Lane, Kingfield, Woking GU22 9DB
| Today | See what it's worth now |
| 3 Oct 2025 | £525,000 |
No other historical records.
Casilla, Kingfield Terrace, Kingfield Road, Kingfield, Woking GU22 9EE

| Today | See what it's worth now |
| 15 Aug 2025 | £440,000 |
| 14 Aug 1995 | £78,000 |
No other historical records.
Flat 1, Bonham House, Kingfield Road, Kingfield, Woking GU22 9DX
| Today | See what it's worth now |
| 1 Aug 2025 | £240,000 |
| 14 Aug 2020 | £240,000 |
6, Kingfield Terrace, Kingfield Road, Kingfield, Woking GU22 9EE
| Today | See what it's worth now |
| 24 Jul 2025 | £307,500 |
No other historical records.
22, Sundridge Road, Kingfield, Woking GU22 9AU
| Today | See what it's worth now |
| 7 Jul 2025 | £630,000 |
No other historical records.
Ivylea, Kingfield Road, Kingfield, Woking GU22 9AA
| Today | See what it's worth now |
| 27 Jun 2025 | £1,000,000 |
| 17 Jan 2014 | £658,000 |
4, Russells Mews, Woking GU22 9FD
| Today | See what it's worth now |
| 14 Apr 2025 | £400,000 |
| 26 Aug 2014 | £289,950 |
No other historical records.
8, Gables Court, Gables Close, Kingfield, Woking GU22 9EA
| Today | See what it's worth now |
| 11 Apr 2025 | £275,000 |
No other historical records.
Flat 3, Bonham House, Kingfield Road, Kingfield, Woking GU22 9DX
| Today | See what it's worth now |
| 11 Apr 2025 | £230,000 |
| 22 May 2007 | £194,950 |
No other historical records.
5, Russells Mews, Woking GU22 9FD
| Today | See what it's worth now |
| 28 Mar 2025 | £415,000 |
| 14 Jun 2019 | £377,000 |
8, Kingfield Gardens, Kingfield, Woking GU22 9DY
| Today | See what it's worth now |
| 28 Mar 2025 | £465,000 |
| 2 Dec 2011 | £258,000 |
12, Trentham Crescent, Old Woking, Woking GU22 9EW
| Today | See what it's worth now |
| 27 Mar 2025 | £475,000 |
No other historical records.
10, Loop Road, Kingfield, Woking GU22 9BQ
| Today | See what it's worth now |
| 17 Mar 2025 | £320,000 |
No other historical records.
4, New Forest Cottages, Kingfield Road, Kingfield, Woking GU22 9DZ
| Today | See what it's worth now |
| 14 Feb 2025 | £350,000 |
| 9 Aug 2013 | £215,000 |
17a, Vicarage Road, Kingfield, Woking GU22 9BH
| Today | See what it's worth now |
| 31 Jan 2025 | £575,000 |
No other historical records.
20, Rosebery Crescent, Kingfield, Woking GU22 9BL
| Today | See what it's worth now |
| 31 Jan 2025 | £635,000 |
| 18 Jul 2014 | £510,500 |
Source Acknowledgement: © Crown copyright. England and Wales house price data is publicly available information produced by the HM Land Registry.This material was last updated on 9 July 2026. It covers the period from 1 January 1995 to 30 April 2026 and contains property transactions which have been registered during that period. Contains HM Land Registry data © Crown copyright and database right 2026. This data is licensed under the Open Government Licence v3.0.
Disclaimer: Rightmove.co.uk provides this HM Land Registry data "as is". The burden for fitness of the data relies completely with the user and is provided for informational purposes only. No warranty, express or implied, is given relating to the accuracy of content of the HM Land Registry data and Rightmove does not accept any liability for error or omission. If you have found an error with the data or need further information please contact HM Land Registry.
Permitted Use: Viewers of this Information are granted permission to access this Crown copyright material and to download it onto electronic, magnetic, optical or similar storage media provided that such activities are for private research, study or in-house use only. Any other use of the material requires the formal written permission of Land Registry which can be requested from us, and is subject to an additional licence and associated charge.
Rightmove takes no liability for your use of, or reliance on, Rightmove's Instant Valuation due to the limitations of our tracking tool listed here. Use of this tool is taken entirely at your own risk. All rights reserved.