
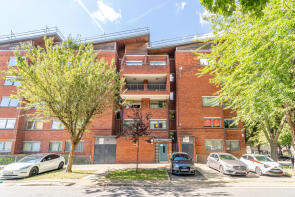
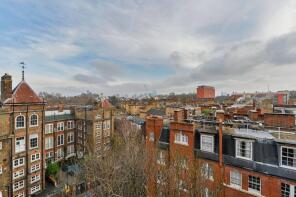
House Prices in Kings Cross
House prices in Kings Cross have an overall average of £801,237 over the last year.
The majority of properties sold in Kings Cross during the last year were flats, selling for an average price of £713,048. Terraced properties sold for an average of £1,466,047.
Overall, the historical sold prices in Kings Cross over the last year were 8% down on the previous year and 24% down on the 2018 peak of £1,048,747.
Properties Sold
32, Manneby Prior, Cumming Street, London N1 9JA
| Today | See what it's worth now |
| 10 Apr 2026 | £550,000 |
| 17 Mar 2015 | £530,000 |
Flat G, 7, Maygood Street, London N1 9QP
| Today | See what it's worth now |
| 8 Apr 2026 | £346,000 |
| 3 Apr 2006 | £199,950 |
No other historical records.
19, 5 Gattis Wharf, New Wharf Road, London N1 9RS
| Today | See what it's worth now |
| 1 Apr 2026 | £432,000 |
| 27 May 2020 | £475,000 |
Flat A, 37, Swinton Street, London WC1X 9NT
| Today | See what it's worth now |
| 31 Mar 2026 | £387,500 |
| 8 Oct 1999 | £197,000 |
No other historical records.
Flat 102, Queen Alexandra Mansions, Hastings Street, London WC1H 9DP
| Today | See what it's worth now |
| 31 Mar 2026 | £470,000 |
| 15 Sep 1998 | £109,000 |
No other historical records.
Flat A, 26, Barnsbury Road, London N1 0HD
| Today | See what it's worth now |
| 27 Mar 2026 | £840,000 |
No other historical records.
20, Percy Circus, London WC1X 9EE

| Today | See what it's worth now |
| 20 Mar 2026 | £793,000 |
| 29 Aug 2014 | £790,000 |
9, Ploughmans Close, London NW1 0XH
| Today | See what it's worth now |
| 13 Mar 2026 | £700,000 |
No other historical records.
Flat 2, 4, Rufford Street, London N1 0AP

| Today | See what it's worth now |
| 9 Mar 2026 | £500,000 |
| 5 Dec 2017 | £412,000 |
Flat 1, Rodmell, Regent Square, London WC1H 8HX
| Today | See what it's worth now |
| 9 Mar 2026 | £357,000 |
No other historical records.
44, Selkirk House, Bingfield Street, London N1 0AB

| Today | See what it's worth now |
| 6 Mar 2026 | £485,000 |
| 5 May 2017 | £379,000 |
Flat Basement And Ground Floor, 7, Acton Street, London WC1X 9LX
| Today | See what it's worth now |
| 6 Mar 2026 | £727,750 |
| 29 Jun 2018 | £840,000 |
No other historical records.
Flat 4, 56, Bemerton Street, London N1 0BN
| Today | See what it's worth now |
| 3 Mar 2026 | £400,000 |
| 28 Jun 2006 | £237,000 |
No other historical records.
Flat 16, Park View House, Goldington Street, London NW1 1UG
| Today | See what it's worth now |
| 27 Feb 2026 | £500,000 |
No other historical records.
Flat A, 34, Barnsbury Road, London N1 0HD
| Today | See what it's worth now |
| 20 Feb 2026 | £444,000 |
| 18 Jan 2022 | £360,000 |
No other historical records.
147, Barker Drive, London NW1 0JZ
| Today | See what it's worth now |
| 6 Feb 2026 | £422,000 |
No other historical records.
Flat 14, 100, Camley Street, London N1C 4EE

| Today | See what it's worth now |
| 30 Jan 2026 | £1,000,000 |
| 7 Oct 2019 | £970,000 |
No other historical records.
Flat 12, 8 Brunswick Mansions, Handel Street, London WC1N 1PE
| Today | See what it's worth now |
| 29 Jan 2026 | £530,000 |
| 24 Sep 2021 | £510,000 |
Flat 2, 87 89, Marchmont Street, London WC1N 1AL

| Today | See what it's worth now |
| 21 Jan 2026 | £860,000 |
| 9 Jul 2007 | £415,000 |
Room 270, Student Accomodation, Pentonville Road, London N1 9JP
| Today | See what it's worth now |
| 20 Jan 2026 | £651,000 |
No other historical records.
79, Weavers Way, London NW1 0XG
| Today | See what it's worth now |
| 16 Jan 2026 | £450,000 |
| 11 Aug 2017 | £378,000 |
Flat Ground Floor, 5, Handel Street, London WC1N 1PB

| Today | See what it's worth now |
| 14 Jan 2026 | £850,000 |
| 27 Nov 2009 | £560,000 |
Flat 14, 60, White Lion Street, London N1 9PH
| Today | See what it's worth now |
| 14 Jan 2026 | £730,000 |
| 5 Apr 2004 | £360,000 |
No other historical records.

Source Acknowledgement: © Crown copyright. England and Wales house price data is publicly available information produced by the HM Land Registry.This material was last updated on 9 July 2026. It covers the period from 1 January 1995 to 30 April 2026 and contains property transactions which have been registered during that period. Contains HM Land Registry data © Crown copyright and database right 2026. This data is licensed under the Open Government Licence v3.0.
Disclaimer: Rightmove.co.uk provides this HM Land Registry data "as is". The burden for fitness of the data relies completely with the user and is provided for informational purposes only. No warranty, express or implied, is given relating to the accuracy of content of the HM Land Registry data and Rightmove does not accept any liability for error or omission. If you have found an error with the data or need further information please contact HM Land Registry.
Permitted Use: Viewers of this Information are granted permission to access this Crown copyright material and to download it onto electronic, magnetic, optical or similar storage media provided that such activities are for private research, study or in-house use only. Any other use of the material requires the formal written permission of Land Registry which can be requested from us, and is subject to an additional licence and associated charge.
Rightmove takes no liability for your use of, or reliance on, Rightmove's Instant Valuation due to the limitations of our tracking tool listed here. Use of this tool is taken entirely at your own risk. All rights reserved.