
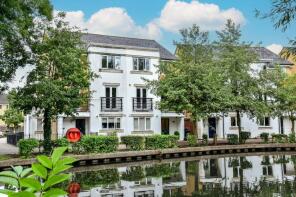
House Prices in Kings Langley
House prices in Kings Langley have an overall average of £598,609 over the last year.
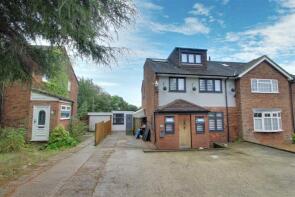
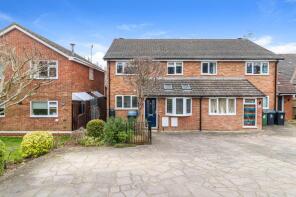
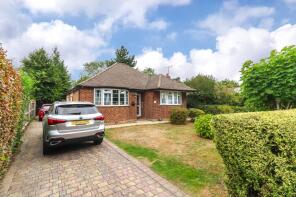
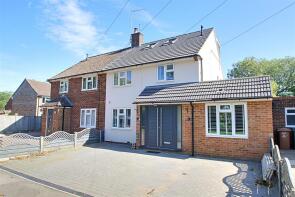
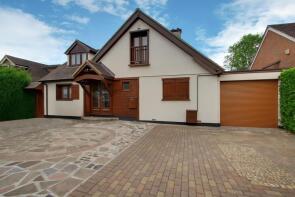
The majority of properties sold in Kings Langley during the last year were semi-detached properties, selling for an average price of £575,511. Terraced properties sold for an average of £498,567, with detached properties fetching £1,019,538.
Overall, the historical sold prices in Kings Langley over the last year were similar to the previous year and similar to the 2022 peak of £596,485.
Properties Sold
35, Pinnacle House, Home Park Mill Link, Kings Langley WD4 8FW

| Today | See what it's worth now |
| 21 Apr 2026 | £220,000 |
| 23 May 2019 | £289,750 |
No other historical records.
74, Toms Lane, Kings Langley WD4 8NB
| Today | See what it's worth now |
| 17 Apr 2026 | £660,000 |
| 26 Apr 2013 | £400,000 |
No other historical records.
50, Alexandra Road, Kings Langley WD4 8DT
| Today | See what it's worth now |
| 8 Apr 2026 | £530,000 |
No other historical records.
30, Rectory Lane, Kings Langley WD4 8EY
| Today | See what it's worth now |
| 31 Mar 2026 | £600,000 |
| 18 Jun 2014 | £447,000 |
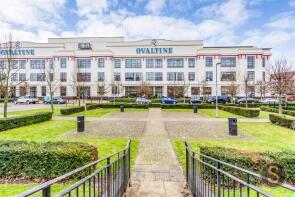
128, Ovaltine Court, Ovaltine Drive, Kings Langley WD4 8GU

| Today | See what it's worth now |
| 31 Mar 2026 | £330,000 |
| 15 May 2015 | £300,000 |
41, High Street, Abbots Langley WD5 0QP

| Today | See what it's worth now |
| 13 Mar 2026 | £450,000 |
| 4 Jun 2007 | £249,950 |
145, Toms Lane, Kings Langley WD4 8NX
| Today | See what it's worth now |
| 10 Mar 2026 | £660,000 |
No other historical records.
2, Meadow Way, Abbots Langley WD5 0RD
| Today | See what it's worth now |
| 27 Feb 2026 | £730,000 |
| 30 Apr 2020 | £495,000 |
51, Hamilton Road, Kings Langley WD4 8PY
| Today | See what it's worth now |
| 27 Feb 2026 | £825,000 |
| 9 Mar 1998 | £160,000 |
No other historical records.
52, Wharf Way, Kings Langley WD4 8FL
| Today | See what it's worth now |
| 27 Feb 2026 | £245,000 |
| 10 Jul 2015 | £265,000 |
50, Wharf Way, Kings Langley WD4 8FL
| Today | See what it's worth now |
| 19 Feb 2026 | £270,000 |
| 8 May 2009 | £190,000 |
No other historical records.
18, Hyde Lane, Nash Mills HP3 8RY
| Today | See what it's worth now |
| 13 Feb 2026 | £340,000 |
No other historical records.
15, Wharf Way, Kings Langley WD4 8FL

| Today | See what it's worth now |
| 12 Feb 2026 | £400,000 |
| 30 May 2017 | £355,000 |
82, Langley Hill, Kings Langley WD4 9HE
| Today | See what it's worth now |
| 11 Feb 2026 | £1,250,000 |
| 10 Dec 2009 | £307,000 |
No other historical records.
82, Upper Highway, Abbots Langley WD5 0JE
| Today | See what it's worth now |
| 9 Feb 2026 | £485,000 |
| 26 Mar 2001 | £99,750 |
No other historical records.
Pende, Whippendell Farm, Langley Road, Chipperfield, Kings Langley WD4 9JG
| Today | See what it's worth now |
| 6 Feb 2026 | £1,167,000 |
| 26 May 2009 | £500,000 |
No other historical records.
8, Chantry Close, Kings Langley WD4 8EX
| Today | See what it's worth now |
| 6 Feb 2026 | £605,000 |
No other historical records.
26, Roman Gardens, Kings Langley WD4 8LG
| Today | See what it's worth now |
| 2 Feb 2026 | £564,500 |
| 16 Nov 2007 | £240,000 |
111, Rucklers Lane, Kings Langley WD4 8BA
| Today | See what it's worth now |
| 30 Jan 2026 | £480,000 |
| 19 Jan 2016 | £351,000 |
No other historical records.
49, Hempstead Road, Kings Langley WD4 8BS
| Today | See what it's worth now |
| 30 Jan 2026 | £765,000 |
No other historical records.
18, Hazelbury Avenue, Abbots Langley WD5 0DF
| Today | See what it's worth now |
| 30 Jan 2026 | £821,000 |
| 1 Nov 2021 | £772,500 |
32, Grand Union Way, Kings Langley WD4 8SS
| Today | See what it's worth now |
| 29 Jan 2026 | £700,000 |
| 5 Apr 2006 | £420,000 |
No other historical records.
Greencroft, Bucks Hill, Kings Langley WD4 9BR
| Today | See what it's worth now |
| 28 Jan 2026 | £942,000 |
| 22 Oct 2014 | £705,000 |
No other historical records.
Source Acknowledgement: © Crown copyright. England and Wales house price data is publicly available information produced by the HM Land Registry.This material was last updated on 9 July 2026. It covers the period from 1 January 1995 to 30 April 2026 and contains property transactions which have been registered during that period. Contains HM Land Registry data © Crown copyright and database right 2026. This data is licensed under the Open Government Licence v3.0.
Disclaimer: Rightmove.co.uk provides this HM Land Registry data "as is". The burden for fitness of the data relies completely with the user and is provided for informational purposes only. No warranty, express or implied, is given relating to the accuracy of content of the HM Land Registry data and Rightmove does not accept any liability for error or omission. If you have found an error with the data or need further information please contact HM Land Registry.
Permitted Use: Viewers of this Information are granted permission to access this Crown copyright material and to download it onto electronic, magnetic, optical or similar storage media provided that such activities are for private research, study or in-house use only. Any other use of the material requires the formal written permission of Land Registry which can be requested from us, and is subject to an additional licence and associated charge.
Rightmove takes no liability for your use of, or reliance on, Rightmove's Instant Valuation due to the limitations of our tracking tool listed here. Use of this tool is taken entirely at your own risk. All rights reserved.