
House Prices in Kingsnordley
House prices in Kingsnordley have an overall average of £292,345 over the last year.
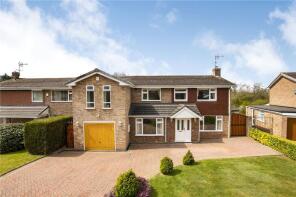
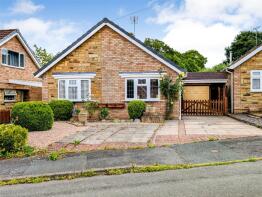
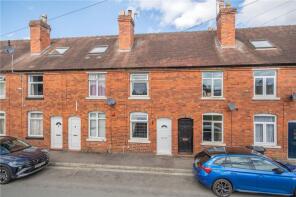
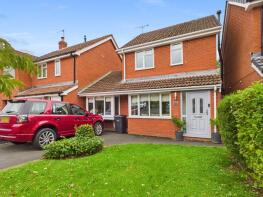
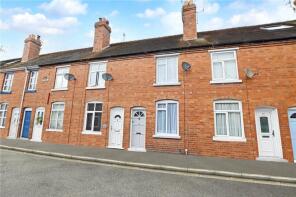
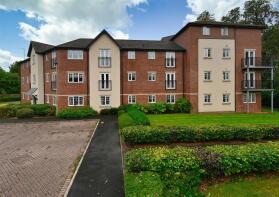
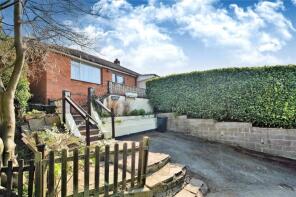
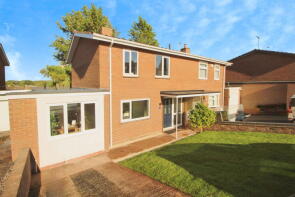
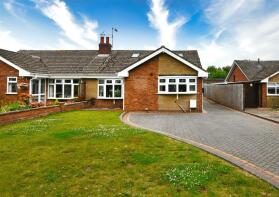
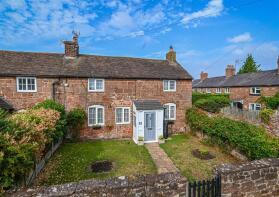
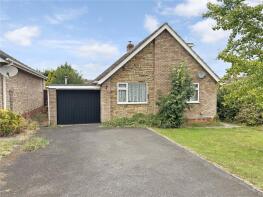
The majority of properties sold in Kingsnordley during the last year were semi-detached properties, selling for an average price of £291,529. Detached properties sold for an average of £340,808, with terraced properties fetching £254,950.
Overall, the historical sold prices in Kingsnordley over the last year were 8% up on the previous year and 8% down on the 2021 peak of £317,331.
Properties Sold
34, Birch Grove, Alveley WV15 6LA
| Today | See what it's worth now |
| 14 Apr 2026 | £445,000 |
No other historical records.
10, Greenleys Crescent, Bridgnorth WV15 6PG
| Today | See what it's worth now |
| 14 Apr 2026 | £325,000 |
| 5 Aug 2016 | £235,000 |
27, Severn Street, Bridgnorth WV15 6BB
| Today | See what it's worth now |
| 10 Apr 2026 | £215,000 |
| 4 Jun 2021 | £165,000 |
47, Greenway Avenue, Bridgnorth WV15 6PB
| Today | See what it's worth now |
| 23 Mar 2026 | £338,000 |
| 14 Dec 2015 | £168,000 |
8, Meadowbrook Close, Bridgnorth WV15 6PD
| Today | See what it's worth now |
| 19 Mar 2026 | £295,000 |
| 2 Oct 2015 | £225,000 |
9, St James Drive, Bridgnorth WV15 6BN
| Today | See what it's worth now |
| 6 Mar 2026 | £310,000 |
| 20 Dec 2012 | £145,000 |
No other historical records.
81, Wellmeadow, Bridgnorth WV15 6DL
| Today | See what it's worth now |
| 27 Feb 2026 | £255,000 |
| 29 Nov 2019 | £187,000 |
No other historical records.
1, Greenleys Crescent, Alveley WV15 6PQ
| Today | See what it's worth now |
| 24 Feb 2026 | £275,000 |
No other historical records.
48, Severn Street, Bridgnorth WV15 6BB

| Today | See what it's worth now |
| 20 Feb 2026 | £207,000 |
| 31 Mar 2022 | £162,000 |
No other historical records.
38, Severn Street, Bridgnorth WV15 6BB
| Today | See what it's worth now |
| 30 Jan 2026 | £200,000 |
| 26 Nov 1999 | £59,950 |
39, Wellmeadow, Bridgnorth WV15 6DG

| Today | See what it's worth now |
| 30 Jan 2026 | £282,000 |
| 20 Jan 2023 | £240,000 |
20, Greyfriars House, Stourbridge Road, Bridgnorth WV15 6AR
| Today | See what it's worth now |
| 26 Jan 2026 | £175,000 |
| 12 May 2017 | £138,500 |
Jessmin, Horse Grove Hill, Bridgnorth WV15 5AU
| Today | See what it's worth now |
| 19 Jan 2026 | £155,000 |
No other historical records.
45, Arden Way, Alveley WV15 6NR
| Today | See what it's worth now |
| 16 Jan 2026 | £267,500 |
No other historical records.
19, Greyfriars House, Stourbridge Road, Bridgnorth WV15 6AR
| Today | See what it's worth now |
| 19 Dec 2025 | £167,500 |
| 21 Feb 2023 | £185,000 |
47, Severn Street, Bridgnorth WV15 6BB
| Today | See what it's worth now |
| 18 Dec 2025 | £243,500 |
| 31 Jan 2020 | £195,000 |
71, Hillside Avenue, Bridgnorth WV15 6BU
| Today | See what it's worth now |
| 17 Dec 2025 | £304,000 |
No other historical records.
28, Wellmeadow, Bridgnorth WV15 6DE
| Today | See what it's worth now |
| 12 Dec 2025 | £290,000 |
| 26 Mar 2021 | £232,000 |
2, Severn Side South, Bridgnorth WV15 6BA
| Today | See what it's worth now |
| 12 Dec 2025 | £425,000 |
| 26 Jan 2015 | £205,000 |
No other historical records.
7, Church Road, Bridgnorth WV15 6NP
| Today | See what it's worth now |
| 9 Dec 2025 | £220,000 |
| 13 May 2004 | £80,000 |
No other historical records.
1, St James Drive, Bridgnorth WV15 6BN
| Today | See what it's worth now |
| 5 Dec 2025 | £350,000 |
| 24 Sep 2021 | £350,000 |
29, Hillside Avenue, Bridgnorth WV15 6BT
| Today | See what it's worth now |
| 28 Nov 2025 | £310,000 |
| 17 May 2022 | £280,000 |
6, Lime Close, Bridgnorth WV15 6LU
| Today | See what it's worth now |
| 28 Nov 2025 | £278,000 |
| 8 Jun 2017 | £187,000 |
Source Acknowledgement: © Crown copyright. England and Wales house price data is publicly available information produced by the HM Land Registry.This material was last updated on 9 July 2026. It covers the period from 1 January 1995 to 30 April 2026 and contains property transactions which have been registered during that period. Contains HM Land Registry data © Crown copyright and database right 2026. This data is licensed under the Open Government Licence v3.0.
Disclaimer: Rightmove.co.uk provides this HM Land Registry data "as is". The burden for fitness of the data relies completely with the user and is provided for informational purposes only. No warranty, express or implied, is given relating to the accuracy of content of the HM Land Registry data and Rightmove does not accept any liability for error or omission. If you have found an error with the data or need further information please contact HM Land Registry.
Permitted Use: Viewers of this Information are granted permission to access this Crown copyright material and to download it onto electronic, magnetic, optical or similar storage media provided that such activities are for private research, study or in-house use only. Any other use of the material requires the formal written permission of Land Registry which can be requested from us, and is subject to an additional licence and associated charge.
Rightmove takes no liability for your use of, or reliance on, Rightmove's Instant Valuation due to the limitations of our tracking tool listed here. Use of this tool is taken entirely at your own risk. All rights reserved.