
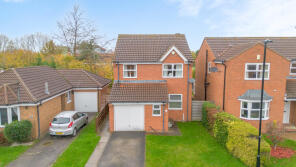
House Prices in Kingsway North
House prices in Kingsway North have an overall average of £345,616 over the last year.
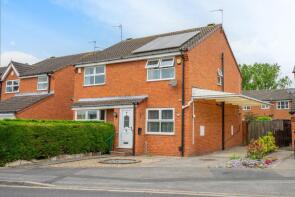
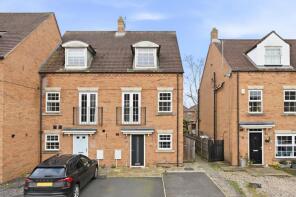
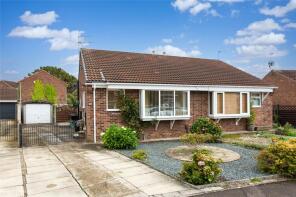
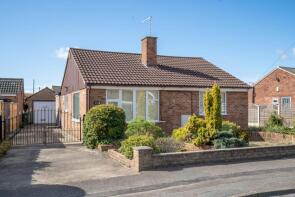
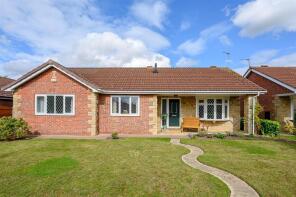
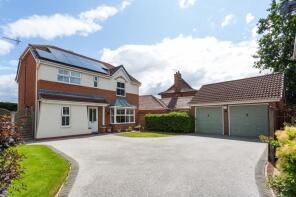
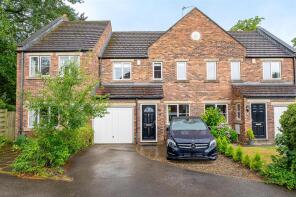
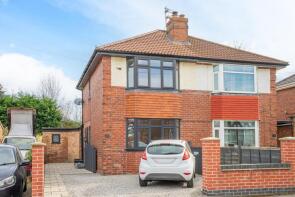
The majority of properties sold in Kingsway North during the last year were semi-detached properties, selling for an average price of £317,188. Detached properties sold for an average of £443,971, with terraced properties fetching £326,167.
Overall, the historical sold prices in Kingsway North over the last year were 8% up on the previous year and 7% down on the 2022 peak of £371,624.
Properties Sold
25, Greystoke Road, York YO30 5FD
| Today | See what it's worth now |
| 13 Mar 2026 | £350,000 |
| 26 Jan 1996 | £77,000 |
No other historical records.
7, Fylingdale Avenue, York YO30 5FP

| Today | See what it's worth now |
| 3 Mar 2026 | £345,000 |
| 30 Aug 2007 | £192,950 |
No other historical records.
9, Buttermere Drive, York YO30 5TQ
| Today | See what it's worth now |
| 23 Feb 2026 | £310,000 |
| 5 Jul 2013 | £155,000 |
No other historical records.
22, Reighton Drive, York YO30 5QP
| Today | See what it's worth now |
| 23 Feb 2026 | £375,000 |
| 21 Mar 1997 | £58,000 |
No other historical records.
60, Rawcliffe Croft, York YO30 5UN
| Today | See what it's worth now |
| 23 Feb 2026 | £428,000 |
| 31 Mar 1999 | £68,000 |
No other historical records.
9, Greystoke Road, York YO30 5FD
| Today | See what it's worth now |
| 11 Feb 2026 | £230,000 |
| 15 Oct 2004 | £137,000 |
No other historical records.
9, Lancaster Way, York YO30 5ZA

| Today | See what it's worth now |
| 26 Jan 2026 | £380,000 |
| 29 Jun 2021 | £278,000 |
No other historical records.
15, Swinton Close, York YO30 5NB
| Today | See what it's worth now |
| 23 Jan 2026 | £360,000 |
| 13 Dec 2019 | £280,000 |
6, Harrow Glade, York YO30 5ZF
| Today | See what it's worth now |
| 19 Jan 2026 | £260,000 |
| 10 May 2002 | £100,000 |
No other historical records.
15, Northolme Drive, York YO30 5RP
| Today | See what it's worth now |
| 12 Dec 2025 | £557,000 |
| 31 Aug 2016 | £255,000 |
63, Eastholme Drive, York YO30 5SZ
| Today | See what it's worth now |
| 12 Dec 2025 | £317,500 |
| 30 Apr 1998 | £82,950 |
No other historical records.
95, Manor Lane, York YO30 5XX
| Today | See what it's worth now |
| 11 Dec 2025 | £442,000 |
| 28 Feb 2001 | £129,950 |
No other historical records.
14, Landau Close, York YO30 5FT
| Today | See what it's worth now |
| 4 Dec 2025 | £520,000 |
| 14 Nov 1997 | £136,995 |
No other historical records.
12, Rosecroft Way, York YO30 5FN
| Today | See what it's worth now |
| 26 Nov 2025 | £340,000 |
| 25 Jun 2013 | £175,000 |
9, Alwyne Grove, York YO30 5RT
| Today | See what it's worth now |
| 21 Nov 2025 | £490,000 |
| 11 Feb 2022 | £456,500 |
Flat 8, Manor House, Cobham Way, York YO30 5NS
| Today | See what it's worth now |
| 14 Nov 2025 | £185,000 |
| 6 Jan 2022 | £162,500 |
1, Riseborough House, Rawcliffe Lane, York YO30 6NQ

| Today | See what it's worth now |
| 7 Nov 2025 | £300,000 |
| 15 Mar 2010 | £179,000 |
No other historical records.
19, Howard Drive, York YO30 5UX
| Today | See what it's worth now |
| 4 Nov 2025 | £425,000 |
| 21 Jul 1997 | £68,000 |
No other historical records.
3, Kensington Road, York YO30 5XG
| Today | See what it's worth now |
| 31 Oct 2025 | £390,000 |
| 24 Mar 2000 | £124,995 |
No other historical records.
9, Byron Drive, York YO30 5SN
| Today | See what it's worth now |
| 31 Oct 2025 | £304,000 |
| 29 Apr 2021 | £255,000 |
47, Rawcliffe Croft, York YO30 5US
| Today | See what it's worth now |
| 31 Oct 2025 | £300,000 |
No other historical records.
8, Howard Link, York YO30 5UU
| Today | See what it's worth now |
| 27 Oct 2025 | £365,000 |
| 27 Aug 2021 | £200,000 |
12, Southolme Drive, York YO30 5RL
| Today | See what it's worth now |
| 27 Oct 2025 | £360,000 |
| 7 Nov 2014 | £195,000 |
No other historical records.
34, Chelkar Way, York YO30 5ZH
| Today | See what it's worth now |
| 16 Oct 2025 | £390,000 |
| 16 Jan 2004 | £151,000 |
23, Bowland Way, York YO30 5PZ
| Today | See what it's worth now |
| 16 Oct 2025 | £330,000 |
| 10 Dec 2020 | £255,000 |
Source Acknowledgement: © Crown copyright. England and Wales house price data is publicly available information produced by the HM Land Registry.This material was last updated on 15 May 2026. It covers the period from 1 January 1995 to 31 March 2026 and contains property transactions which have been registered during that period. Contains HM Land Registry data © Crown copyright and database right 2026. This data is licensed under the Open Government Licence v3.0.
Disclaimer: Rightmove.co.uk provides this HM Land Registry data "as is". The burden for fitness of the data relies completely with the user and is provided for informational purposes only. No warranty, express or implied, is given relating to the accuracy of content of the HM Land Registry data and Rightmove does not accept any liability for error or omission. If you have found an error with the data or need further information please contact HM Land Registry.
Permitted Use: Viewers of this Information are granted permission to access this Crown copyright material and to download it onto electronic, magnetic, optical or similar storage media provided that such activities are for private research, study or in-house use only. Any other use of the material requires the formal written permission of Land Registry which can be requested from us, and is subject to an additional licence and associated charge.
Map data ©OpenStreetMap contributors.
Rightmove takes no liability for your use of, or reliance on, Rightmove's Instant Valuation due to the limitations of our tracking tool listed here. Use of this tool is taken entirely at your own risk. All rights reserved.