
House Prices in Kingsway
House prices in Kingsway have an overall average of £221,457 over the last year.
The majority of properties sold in Kingsway during the last year were semi-detached properties, selling for an average price of £224,292. Detached properties sold for an average of £321,750, with terraced properties fetching £169,250.
Overall, the historical sold prices in Kingsway over the last year were 4% up on the previous year and 3% up on the 2023 peak of £214,000.
Properties Sold
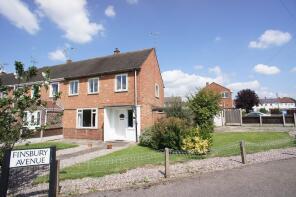
2, Finsbury Avenue, Derby DE22 4BT
| Today | See today's value |
| 15 Jul 2026 | £180,000 |
| 22 Nov 2013 | £115,000 |
No other historical records.
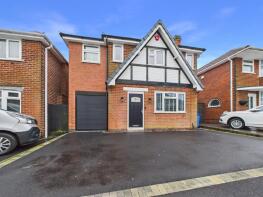
9, Laburnum Grove, Derby DE22 4AX
| Today | See today's value |
| 19 Jun 2026 | £360,000 |
| 22 Sep 2021 | £175,000 |
No other historical records.
42, Greenland Avenue, Derby DE22 4AP
| Today | See today's value |
| 16 Jun 2026 | £212,000 |
| 30 Sep 2021 | £180,000 |
No other historical records.
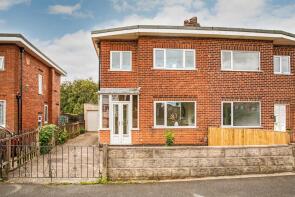
31, Greenland Avenue, Derby DE22 4AQ
| Today | See today's value |
| 1 Jun 2026 | £135,000 |
No other historical records.
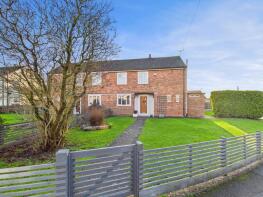
35, Hendon Way, Derby DE22 4BZ
| Today | See today's value |
| 27 May 2026 | £235,000 |
No other historical records.
8, Fulham Road, Derby DE22 4GB

| Today | See today's value |
| 20 May 2026 | £185,000 |
| 21 Apr 1995 | £37,000 |
No other historical records.
31, Brentford Drive, Derby DE22 4BP

| Today | See today's value |
| 30 Apr 2026 | £225,000 |
| 22 Sep 2016 | £132,500 |
No other historical records.
Flat 15, Lancaster House, Somerset Close, Derby DE22 3XR
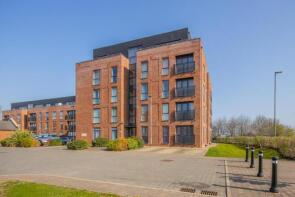
| Today | See today's value |
| 30 Apr 2026 | £143,000 |
| 1 Dec 2016 | £130,995 |
No other historical records.
73, Cheviot Street, Derby DE22 3EY

| Today | See today's value |
| 2 Apr 2026 | £205,000 |
| 19 Dec 2008 | £91,000 |
134, Radbourne Street, Derby DE22 3BU

| Today | See today's value |
| 23 Mar 2026 | £235,000 |
| 30 Sep 2019 | £170,000 |
No other historical records.
67, Brackensdale Avenue, Derby DE22 4AF

| Today | See today's value |
| 13 Mar 2026 | £227,000 |
| 25 Aug 1999 | £51,000 |
No other historical records.
5, Lilac Avenue, Derby DE22 4AS

| Today | See today's value |
| 27 Feb 2026 | £198,000 |
| 5 Apr 2017 | £144,500 |
Flat 12, Lancaster House, Somerset Close, Derby DE22 3XR

| Today | See today's value |
| 26 Feb 2026 | £145,000 |
| 2 Dec 2016 | £132,995 |
No other historical records.
85, Brackensdale Avenue, Derby DE22 4AF

| Today | See today's value |
| 16 Feb 2026 | £292,000 |
| 17 Sep 2021 | £234,500 |
22, Westleigh Avenue, Derby DE22 3BX

| Today | See today's value |
| 6 Feb 2026 | £225,000 |
| 14 Sep 2016 | £145,000 |
51, Brackensdale Avenue, Derby DE22 4AF

| Today | See today's value |
| 7 Jan 2026 | £270,000 |
| 22 Sep 2016 | £177,500 |
16, Trowels Lane, Derby DE22 3LS

| Today | See today's value |
| 19 Dec 2025 | £224,500 |
| 12 May 2016 | £146,000 |
No other historical records.
10, Yoxall Drive, Derby DE22 3SF

| Today | See today's value |
| 19 Dec 2025 | £365,000 |
| 21 Jun 2002 | £137,995 |
No other historical records.
13, Raleigh Street, Derby DE22 3FF
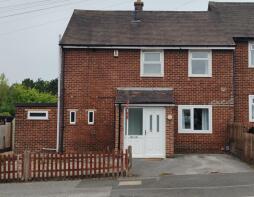
| Today | See today's value |
| 15 Dec 2025 | £140,000 |
| 16 Jan 2023 | £181,000 |
17, Somerset Close, Derby DE22 3XP
| Today | See today's value |
| 10 Dec 2025 | £197,000 |
No other historical records.
24, Thornhill Road, Derby DE22 3LX

| Today | See today's value |
| 29 Oct 2025 | £375,000 |
| 1 Nov 2023 | £350,000 |
Flat 10, Lancaster House, Somerset Close, Derby DE22 3XR

| Today | See today's value |
| 6 Oct 2025 | £150,000 |
| 28 Aug 2020 | £137,000 |
19, Kensal Rise, Derby DE22 4DA

| Today | See today's value |
| 1 Oct 2025 | £170,000 |
No other historical records.
Rightmove takes no liability for your use of, or reliance on, Rightmove's Instant Valuation due to the limitations of our tracking tool listed here. Use of this tool is taken entirely at your own risk. All rights reserved.