
House Prices in Kinkry Hill
House prices in Kinkry Hill have an overall average of £327,438 over the last year.
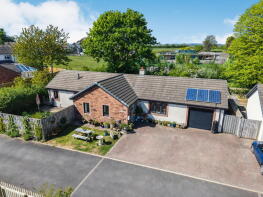
The majority of properties sold in Kinkry Hill during the last year were detached properties, selling for an average price of £356,500. Semi-detached properties sold for an average of £260,500, with terraced properties fetching £220,000.
Overall, the historical sold prices in Kinkry Hill over the last year were similar to the previous year and 3% down on the 2022 peak of £338,558.
Properties Sold
Rosedale, Kirklinton CA6 6BP
| Today | See what it's worth now |
| 10 Feb 2026 | £325,000 |
| 18 Aug 2017 | £215,000 |
No other historical records.
Dunno, Westlinton CA6 6AA
| Today | See what it's worth now |
| 16 Dec 2025 | £270,000 |
No other historical records.
3, Dacre Road, Hethersgill CA6 6EP
| Today | See what it's worth now |
| 10 Dec 2025 | £220,000 |
| 31 Mar 1999 | £49,000 |
25, Sleetbeck Road, Carlisle CA6 6PA

| Today | See what it's worth now |
| 8 Dec 2025 | £260,500 |
| 7 Sep 2018 | £112,000 |
No other historical records.
Hillside, Bewcastle CA6 6PU
| Today | See what it's worth now |
| 14 Nov 2025 | £402,000 |
| 22 Nov 2007 | £880,000 |
No other historical records.
Lyne Lodge, Westlinton CA6 6AA
| Today | See what it's worth now |
| 26 Sep 2025 | £352,000 |
No other historical records.
The Croft, Hethersgill CA6 6EH

| Today | See what it's worth now |
| 21 Jul 2025 | £440,000 |
| 22 Aug 2019 | £223,000 |
20, Ryehill Park, Smithfield, Carlisle CA6 6BH
| Today | See what it's worth now |
| 16 Jun 2025 | £350,000 |
| 20 May 2016 | £182,500 |
No other historical records.
Solway View, Road From Whitberryburn North To Corner House, Carlisle CA6 6NE
| Today | See what it's worth now |
| 21 May 2025 | £205,000 |
| 2 Sep 2016 | £120,000 |
Mallsburn Cottage, Road Leading From Sleet Beck Bridge To Solport Bridge, Carlisle CA6 6LN
| Today | See what it's worth now |
| 4 Apr 2025 | £365,000 |
| 16 Sep 2002 | £60,000 |
No other historical records.
Copper Beeches, Sikeside, Kirklinton CA6 6DR
| Today | See what it's worth now |
| 28 Mar 2025 | £480,000 |
| 12 Nov 2021 | £575,000 |
Belmar, Kirklinton CA6 6BP

| Today | See what it's worth now |
| 25 Mar 2025 | £240,000 |
| 23 Nov 2001 | £85,250 |
No other historical records.
Kinkry Hill Cottage, Road Leading From Oakshaw Ford To Roadhead Via Kinkry Hill, Carlisle CA6 6NG

| Today | See what it's worth now |
| 27 Feb 2025 | £200,000 |
| 12 Jun 2018 | £150,000 |
Alder House, Sikeside, Kirklinton CA6 6DR
| Today | See what it's worth now |
| 25 Feb 2025 | £510,000 |
| 24 Nov 2004 | £310,000 |
No other historical records.
3 Hillcrest, Cannon Field, Road From Whitberryburn North To Corner House, Carlisle CA6 6NB
| Today | See what it's worth now |
| 31 Jan 2025 | £249,950 |
| 23 Sep 2020 | £170,000 |
No other historical records.
Pear Tree Cottage, Kirklinton CA6 6BP
| Today | See what it's worth now |
| 16 Dec 2024 | £310,000 |
No other historical records.
Longlands, Skitby Road, Carlisle CA6 6DL
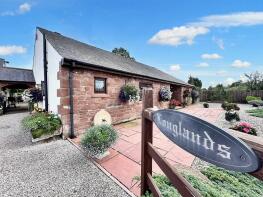
| Today | See what it's worth now |
| 12 Dec 2024 | £595,000 |
| 5 Aug 2005 | £345,000 |
4, Alstonby Court, Carlisle CA6 6AF
| Today | See what it's worth now |
| 9 Dec 2024 | £475,000 |
| 5 Aug 2015 | £345,000 |
Longrigg House, Roweltown CA6 6LF
| Today | See what it's worth now |
| 2 Dec 2024 | £200,000 |
| 16 Dec 2014 | £157,000 |
No other historical records.
Myrtle Cottage, Hethersgill CA6 6HX
| Today | See what it's worth now |
| 7 Nov 2024 | £450,000 |
| 21 Oct 2005 | £300,000 |
No other historical records.
6, Cannon Field, Road From Whitberryburn North To Corner House, Carlisle CA6 6NB
| Today | See what it's worth now |
| 31 Oct 2024 | £320,000 |
| 4 Dec 2020 | £262,500 |
Sandcrook, Access Road To The Flatt From The U1036, Carlisle CA6 6PQ

| Today | See what it's worth now |
| 23 Aug 2024 | £216,000 |
| 17 Nov 2000 | £40,000 |
No other historical records.
The Myre, Roadhead CA6 6PQ

| Today | See what it's worth now |
| 21 Aug 2024 | £200,000 |
No other historical records.

Source Acknowledgement: © Crown copyright. England and Wales house price data is publicly available information produced by the HM Land Registry.This material was last updated on 15 May 2026. It covers the period from 1 January 1995 to 31 March 2026 and contains property transactions which have been registered during that period. Contains HM Land Registry data © Crown copyright and database right 2026. This data is licensed under the Open Government Licence v3.0.
Disclaimer: Rightmove.co.uk provides this HM Land Registry data "as is". The burden for fitness of the data relies completely with the user and is provided for informational purposes only. No warranty, express or implied, is given relating to the accuracy of content of the HM Land Registry data and Rightmove does not accept any liability for error or omission. If you have found an error with the data or need further information please contact HM Land Registry.
Permitted Use: Viewers of this Information are granted permission to access this Crown copyright material and to download it onto electronic, magnetic, optical or similar storage media provided that such activities are for private research, study or in-house use only. Any other use of the material requires the formal written permission of Land Registry which can be requested from us, and is subject to an additional licence and associated charge.
Map data ©OpenStreetMap contributors.
Rightmove takes no liability for your use of, or reliance on, Rightmove's Instant Valuation due to the limitations of our tracking tool listed here. Use of this tool is taken entirely at your own risk. All rights reserved.