
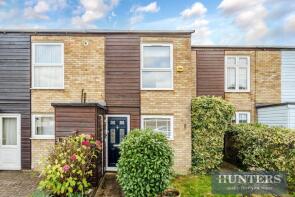
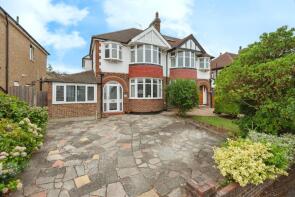
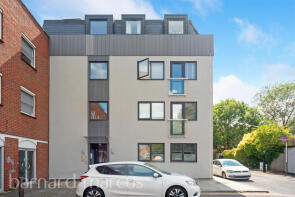
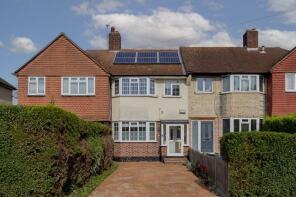
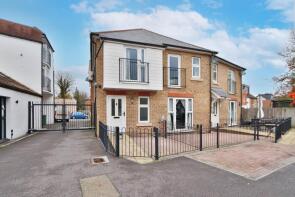
House Prices in KT4
House prices in KT4 have an overall average of £574,103 over the last year.
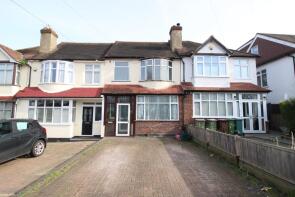
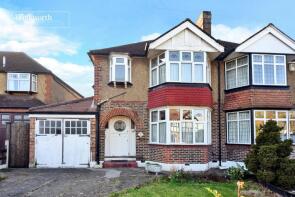
The majority of properties sold in KT4 during the last year were terraced properties, selling for an average price of £535,253. Semi-detached properties sold for an average of £683,808, with flats fetching £310,191.
Overall, the historical sold prices in KT4 over the last year were 2% down on the previous year and 1% up on the 2022 peak of £565,837.
Properties Sold
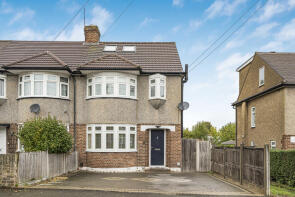
3, Edwards Close, Worcester Park KT4 8PE
| Today | See what it's worth now |
| 24 Apr 2026 | £415,000 |
| 22 May 2007 | £240,000 |
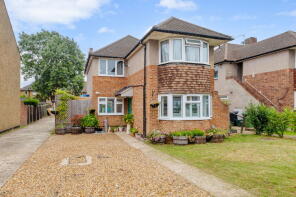
81, The Manor Drive, Worcester Park KT4 7LL
| Today | See what it's worth now |
| 16 Apr 2026 | £815,000 |
| 29 Apr 2004 | £330,000 |
No other historical records.
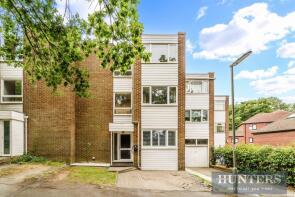
Flat 7, 14 Mercury House, Park Terrace, Worcester Park KT4 7JZ
| Today | See what it's worth now |
| 2 Apr 2026 | £270,000 |
| 26 May 2017 | £304,000 |
No other historical records.
Extensions and planning permission in KT4
See planning approval stats, extension build costs and value added estimates.

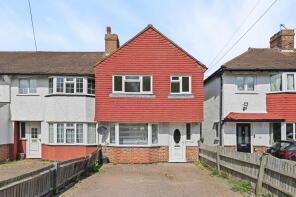
23, Caverleigh Way, Worcester Park KT4 8DH
| Today | See what it's worth now |
| 2 Apr 2026 | £490,000 |
| 28 Aug 2015 | £385,000 |
Flat 15, 14 Mercury House, Park Terrace, Worcester Park KT4 7JZ

| Today | See what it's worth now |
| 1 Apr 2026 | £260,000 |
| 26 May 2017 | £259,000 |
No other historical records.
1, Crystal Place, Worcester Park KT4 8QN
| Today | See what it's worth now |
| 1 Apr 2026 | £355,000 |
| 28 May 2014 | £323,000 |
21, Bridgewood Road, Worcester Park KT4 8XP
| Today | See what it's worth now |
| 31 Mar 2026 | £515,000 |
| 10 Dec 2014 | £415,000 |
No other historical records.
91, Leyfield, Worcester Park KT4 7LP
| Today | See what it's worth now |
| 30 Mar 2026 | £735,000 |
No other historical records.
9, Fairford Gardens, Worcester Park KT4 7BQ
| Today | See what it's worth now |
| 30 Mar 2026 | £780,000 |
| 12 Jun 1998 | £164,500 |
No other historical records.
11, Perry How, Worcester Park KT4 7PQ
| Today | See what it's worth now |
| 27 Mar 2026 | £747,500 |
| 18 May 2001 | £272,500 |
73a, Langley Avenue, Worcester Park KT4 8PD

| Today | See what it's worth now |
| 25 Mar 2026 | £519,000 |
| 1 Sep 2009 | £265,000 |
26, Sandringham Road, Worcester Park KT4 8XW

| Today | See what it's worth now |
| 24 Mar 2026 | £675,000 |
| 25 Jan 2013 | £409,950 |
8, Dundela Gardens, Worcester Park KT4 8UB
| Today | See what it's worth now |
| 24 Mar 2026 | £685,000 |
| 20 Jan 1995 | £11,800 |
No other historical records.
110, Tudor Avenue, Worcester Park KT4 8TU

| Today | See what it's worth now |
| 24 Mar 2026 | £700,000 |
| 11 Jul 2006 | £382,000 |
212, Stoneleigh Avenue, Worcester Park KT4 8YB
| Today | See what it's worth now |
| 20 Mar 2026 | £530,000 |
| 22 Dec 1998 | £134,950 |
No other historical records.
26, Mortimer Crescent, Worcester Park KT4 7QW
| Today | See what it's worth now |
| 13 Mar 2026 | £665,000 |
No other historical records.
Flat 6, 2c Kings Court, Colborne Way, Worcester Park KT4 8LS
| Today | See what it's worth now |
| 12 Mar 2026 | £320,000 |
| 1 Mar 2022 | £355,000 |
123, Caldbeck Avenue, Worcester Park KT4 8BJ

| Today | See what it's worth now |
| 12 Mar 2026 | £610,000 |
| 26 Jan 2016 | £455,000 |
No other historical records.
41, St Philips Avenue, Worcester Park KT4 8JS
| Today | See what it's worth now |
| 11 Mar 2026 | £730,000 |
| 30 Jun 2017 | £540,000 |
143, Vale Road, Worcester Park KT4 7ED
| Today | See what it's worth now |
| 6 Mar 2026 | £395,000 |
| 30 Aug 2000 | £115,000 |
No other historical records.
10, Barrow Hill Close, Worcester Park KT4 7PT
| Today | See what it's worth now |
| 5 Mar 2026 | £600,000 |
| 14 Jul 2022 | £575,000 |
39, Dorchester Road, Worcester Park KT4 8NW
| Today | See what it's worth now |
| 4 Mar 2026 | £470,000 |
| 27 Nov 1998 | £109,000 |
100, Kingsmead Avenue, Worcester Park KT4 8UT
| Today | See what it's worth now |
| 27 Feb 2026 | £1,100,000 |
No other historical records.
Source Acknowledgement: © Crown copyright. England and Wales house price data is publicly available information produced by the HM Land Registry.This material was last updated on 9 July 2026. It covers the period from 1 January 1995 to 30 April 2026 and contains property transactions which have been registered during that period. Contains HM Land Registry data © Crown copyright and database right 2026. This data is licensed under the Open Government Licence v3.0.
Disclaimer: Rightmove.co.uk provides this HM Land Registry data "as is". The burden for fitness of the data relies completely with the user and is provided for informational purposes only. No warranty, express or implied, is given relating to the accuracy of content of the HM Land Registry data and Rightmove does not accept any liability for error or omission. If you have found an error with the data or need further information please contact HM Land Registry.
Permitted Use: Viewers of this Information are granted permission to access this Crown copyright material and to download it onto electronic, magnetic, optical or similar storage media provided that such activities are for private research, study or in-house use only. Any other use of the material requires the formal written permission of Land Registry which can be requested from us, and is subject to an additional licence and associated charge.
Rightmove takes no liability for your use of, or reliance on, Rightmove's Instant Valuation due to the limitations of our tracking tool listed here. Use of this tool is taken entirely at your own risk. All rights reserved.