
House Prices in Ladder Hill
House prices in Ladder Hill have an overall average of £513,309 over the last year.
The majority of properties sold in Ladder Hill during the last year were detached properties, selling for an average price of £682,430. Semi-detached properties sold for an average of £455,516, with terraced properties fetching £383,130.
Overall, the historical sold prices in Ladder Hill over the last year were 6% down on the previous year and 13% down on the 2023 peak of £591,802.
Properties Sold
2a, Leyshon Road, Wheatley, Oxford OX33 1XF
| Today | See today's value |
| 18 Aug 2026 | £350,000 |
| 14 May 2021 | £357,500 |
No other historical records.
19a, Farm Close Road, Wheatley, Oxford OX33 1UQ
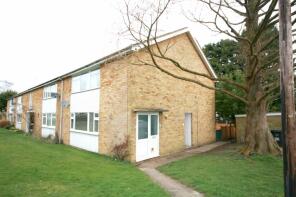
| Today | See today's value |
| 5 Aug 2026 | £250,000 |
| 23 Jun 2006 | £140,000 |
8, Robins Court, Wheatley, Oxford OX33 1ZD
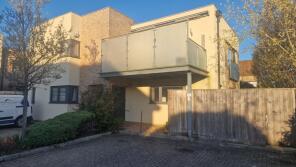
| Today | See today's value |
| 31 Jul 2026 | £315,000 |
| 22 Nov 2013 | £240,000 |
No other historical records.
12, Mickle Way, Forest Hill, Oxford OX33 1DX
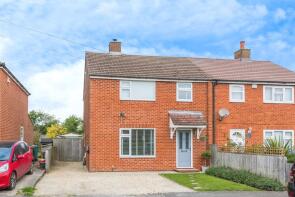
| Today | See today's value |
| 30 Jul 2026 | £410,276 |
| 22 Aug 2014 | £265,000 |
9, Acremead Road, Wheatley, Oxford OX33 1NZ

| Today | See today's value |
| 13 Jul 2026 | £440,000 |
| 6 Feb 2017 | £385,000 |
11, Hillary Way, Wheatley, Oxford OX33 1UY

| Today | See today's value |
| 10 Jun 2026 | £611,000 |
| 23 Oct 2000 | £160,000 |
No other historical records.
23, Elton Crescent, Wheatley, Oxford OX33 1UZ

| Today | See today's value |
| 10 Jun 2026 | £439,000 |
| 5 May 2016 | £317,500 |
No other historical records.
15, Fairfax Gate, Holton, Oxford OX33 1QE
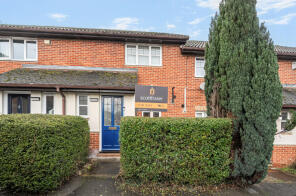
| Today | See today's value |
| 27 May 2026 | £320,000 |
| 15 Jan 2002 | £125,000 |
25, Fairfax Gate, Holton, Oxford OX33 1QE

| Today | See today's value |
| 22 May 2026 | £325,000 |
| 9 Dec 2016 | £300,000 |
28, Westfield Road, Wheatley, Oxford OX33 1NG
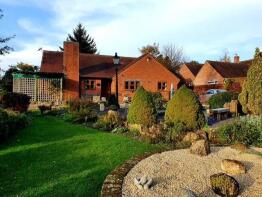
| Today | See today's value |
| 21 May 2026 | £757,500 |
No other historical records.
35, Mickle Way, Forest Hill, Oxford OX33 1DU

| Today | See today's value |
| 1 May 2026 | £400,000 |
| 21 Apr 2022 | £400,000 |
10a, Barlow Close, Wheatley, Oxford OX33 1NL

| Today | See today's value |
| 24 Apr 2026 | £845,000 |
| 28 Nov 2013 | £530,000 |
No other historical records.
14, Spring Lane, Horspath, Oxford OX33 1SA

| Today | See today's value |
| 20 Apr 2026 | £420,000 |
| 19 Nov 1999 | £155,000 |
No other historical records.
26, Gidley Way, Horspath, Oxford OX33 1RG
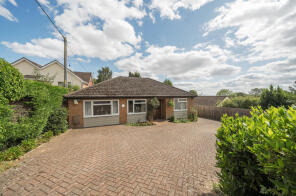
| Today | See today's value |
| 16 Apr 2026 | £520,000 |
No other historical records.
20 Spion Cops, Kellys Road, Wheatley, Oxford OX33 1NT

| Today | See today's value |
| 15 Apr 2026 | £525,000 |
| 6 Jul 2001 | £232,000 |
No other historical records.
The Old Engine House, Studley Priory, Street Off Main Street, Horton-cum-studley, Horton Cum Studley OX33 1AY

| Today | See today's value |
| 31 Mar 2026 | £832,240 |
| 31 May 2013 | £537,500 |
No other historical records.
90, London Road, Wheatley, Oxford OX33 1YQ

| Today | See today's value |
| 17 Mar 2026 | £515,000 |
| 22 Mar 2013 | £303,500 |
60, Kelham Hall Drive, Wheatley, Oxford OX33 1YB

| Today | See today's value |
| 3 Mar 2026 | £330,000 |
| 7 Nov 2003 | £175,000 |
117 Birch House, Old Road, Wheatley, Oxford OX33 1NX
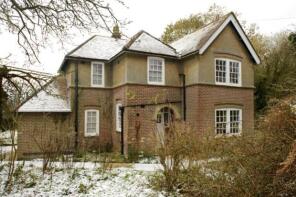
| Today | See today's value |
| 27 Feb 2026 | £1,450,000 |
| 5 May 2011 | £710,000 |
No other historical records.
Stone Crest, Main Street, Forest Hill, Oxford OX33 1DZ
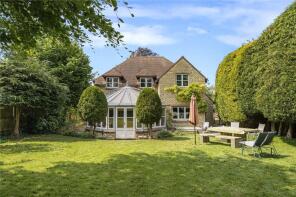
| Today | See today's value |
| 9 Feb 2026 | £893,000 |
No other historical records.
19, Mulberry Drive, Wheatley, Oxford OX33 1UT

| Today | See today's value |
| 3 Feb 2026 | £582,500 |
| 25 Jun 2018 | £525,000 |
3, College Way, Horspath, Oxford OX33 1SQ

| Today | See today's value |
| 3 Feb 2026 | £429,000 |
| 10 Aug 2018 | £370,000 |
No other historical records.
29, Church Road, Wheatley, Oxford OX33 1LZ

| Today | See today's value |
| 23 Jan 2026 | £372,500 |
| 25 Sep 2014 | £262,500 |


Rightmove takes no liability for your use of, or reliance on, Rightmove's Instant Valuation due to the limitations of our tracking tool listed here. Use of this tool is taken entirely at your own risk. All rights reserved.