
House Prices in Laleham
House prices in Laleham have an overall average of £560,437 over the last year.
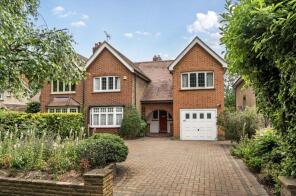
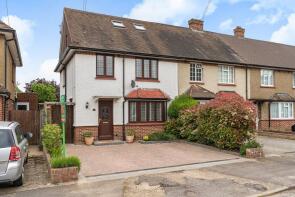
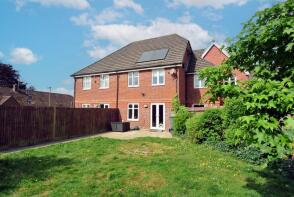
The majority of properties sold in Laleham during the last year were detached properties, selling for an average price of £681,556. Semi-detached properties sold for an average of £561,769, with terraced properties fetching £460,771.
Overall, the historical sold prices in Laleham over the last year were similar to the previous year and 5% down on the 2023 peak of £587,480.
Properties Sold
14, Booth Drive, Laleham TW18 1PR
| Today | See what it's worth now |
| 14 Apr 2026 | £325,000 |
| 22 May 2024 | £305,000 |
No other historical records.
70, Shaftesbury Crescent, Staines-upon-thames TW18 1QW
| Today | See what it's worth now |
| 10 Apr 2026 | £465,000 |
| 28 Feb 2023 | £435,000 |
9, Willowmead, Staines-upon-thames TW18 2SH
| Today | See what it's worth now |
| 13 Mar 2026 | £385,000 |
| 3 Nov 2006 | £197,000 |
196, Staines Road, Staines-upon-thames TW18 2RT
| Today | See what it's worth now |
| 6 Mar 2026 | £350,000 |
| 6 Jan 2007 | £367,500 |
77, Shaftesbury Crescent, Staines-upon-thames TW18 1QL
| Today | See what it's worth now |
| 19 Feb 2026 | £440,000 |
| 26 Apr 2019 | £400,000 |
No other historical records.
23, Charles Road, Staines-upon-thames TW18 1JU
| Today | See what it's worth now |
| 12 Feb 2026 | £506,000 |
| 10 May 2021 | £420,000 |
No other historical records.
63, Lansdowne Road, Staines-upon-thames TW18 1HH

| Today | See what it's worth now |
| 6 Feb 2026 | £725,000 |
| 21 Jun 2019 | £455,000 |
245, Staines Road, Staines-upon-thames TW18 2RS
| Today | See what it's worth now |
| 5 Feb 2026 | £675,000 |
| 11 Dec 2014 | £460,000 |
No other historical records.
80, Staines Road, Staines-upon-thames TW18 2SU

| Today | See what it's worth now |
| 23 Jan 2026 | £598,222 |
| 15 Jun 2021 | £780,000 |
No other historical records.
76, Charles Road, Staines-upon-thames TW18 1JX
| Today | See what it's worth now |
| 16 Jan 2026 | £510,000 |
| 27 Jul 2020 | £425,000 |
42, Charles Road, Staines-upon-thames TW18 1JX
| Today | See what it's worth now |
| 16 Jan 2026 | £490,000 |
| 7 Jan 2019 | £375,000 |
4, Cedar Close, Staines-upon-thames TW18 2TF

| Today | See what it's worth now |
| 9 Jan 2026 | £400,000 |
| 30 Sep 2021 | £280,000 |
Salem Cottage, Vicarage Lane, Laleham TW18 1UE

| Today | See what it's worth now |
| 9 Jan 2026 | £470,000 |
No other historical records.
10, Shepperton Road, Staines-upon-thames TW18 1SD
| Today | See what it's worth now |
| 18 Dec 2025 | £640,000 |
| 1 Apr 2022 | £507,620 |
9, Hereford Close, Staines-upon-thames TW18 2SA
| Today | See what it's worth now |
| 20 Nov 2025 | £627,000 |
| 2 Jul 1996 | £150,000 |
No other historical records.
71, Ashford Road, Staines-upon-thames TW18 1RX
| Today | See what it's worth now |
| 14 Nov 2025 | £890,000 |
| 11 Aug 1995 | £200,000 |
No other historical records.
387, Ashford Road, Laleham TW18 1QG
| Today | See what it's worth now |
| 14 Nov 2025 | £740,000 |
No other historical records.
377, Ashford Road, Staines-upon-thames TW18 1QG
| Today | See what it's worth now |
| 10 Nov 2025 | £470,000 |
| 13 Feb 2016 | £375,000 |
41, Berryscroft Road, Staines-upon-thames TW18 1ND
| Today | See what it's worth now |
| 28 Oct 2025 | £565,000 |
| 12 May 1997 | £91,000 |
No other historical records.
5, Albany Way, Staines-upon-thames TW18 1BG
| Today | See what it's worth now |
| 20 Oct 2025 | £450,000 |
| 30 Apr 2021 | £348,000 |
42, Northfield Road, Staines-upon-thames TW18 2SR

| Today | See what it's worth now |
| 3 Oct 2025 | £538,000 |
| 14 Dec 2018 | £355,000 |
No other historical records.
66, Charles Road, Staines-upon-thames TW18 1JX

| Today | See what it's worth now |
| 3 Oct 2025 | £470,000 |
| 13 Jun 2017 | £190,500 |
No other historical records.
5, Shaftesbury Crescent, Staines-upon-thames TW18 1QL
| Today | See what it's worth now |
| 30 Sep 2025 | £525,000 |
| 12 Oct 2009 | £305,000 |
No other historical records.
Source Acknowledgement: © Crown copyright. England and Wales house price data is publicly available information produced by the HM Land Registry.This material was last updated on 9 July 2026. It covers the period from 1 January 1995 to 30 April 2026 and contains property transactions which have been registered during that period. Contains HM Land Registry data © Crown copyright and database right 2026. This data is licensed under the Open Government Licence v3.0.
Disclaimer: Rightmove.co.uk provides this HM Land Registry data "as is". The burden for fitness of the data relies completely with the user and is provided for informational purposes only. No warranty, express or implied, is given relating to the accuracy of content of the HM Land Registry data and Rightmove does not accept any liability for error or omission. If you have found an error with the data or need further information please contact HM Land Registry.
Permitted Use: Viewers of this Information are granted permission to access this Crown copyright material and to download it onto electronic, magnetic, optical or similar storage media provided that such activities are for private research, study or in-house use only. Any other use of the material requires the formal written permission of Land Registry which can be requested from us, and is subject to an additional licence and associated charge.
Rightmove takes no liability for your use of, or reliance on, Rightmove's Instant Valuation due to the limitations of our tracking tool listed here. Use of this tool is taken entirely at your own risk. All rights reserved.