
House Prices in Lancaster
House prices in Lancaster have an overall average of £215,627 over the last year.
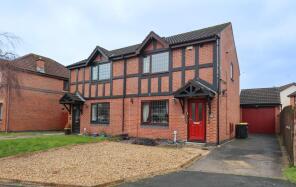
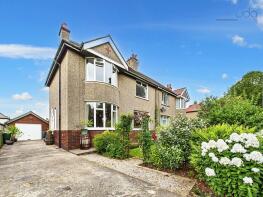
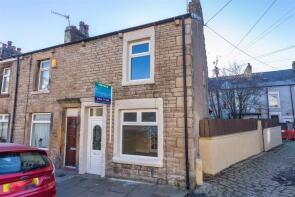
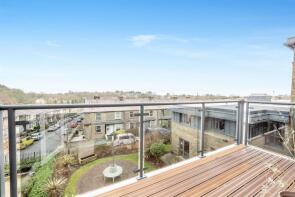
The majority of properties sold in Lancaster during the last year were terraced properties, selling for an average price of £170,534. Semi-detached properties sold for an average of £237,253, with flats fetching £125,954.
Overall, the historical sold prices in Lancaster over the last year were similar to the previous year and 1% up on the 2022 peak of £213,435.
Properties Sold
64, Ashton Drive, Lancaster LA1 2LH
| Today | See what it's worth now |
| 24 Apr 2026 | £195,000 |
| 5 Nov 2008 | £134,950 |
5, Fife Street, Lancaster LA1 5TT
| Today | See what it's worth now |
| 17 Apr 2026 | £315,000 |
| 9 Aug 2018 | £224,995 |
No other historical records.
9, Slyne Road, Lancaster LA1 2HX
| Today | See what it's worth now |
| 17 Apr 2026 | £270,000 |
| 13 Aug 2008 | £229,000 |
67, Coniston Road, Lancaster LA1 3NW

| Today | See what it's worth now |
| 10 Apr 2026 | £161,000 |
| 9 Jun 2023 | £160,000 |
1, Hodder Avenue, Morecambe LA3 3SE
| Today | See what it's worth now |
| 10 Apr 2026 | £315,000 |
| 27 Nov 2014 | £198,000 |
126, North Wing The Residence, Kershaw Drive, Lancaster LA1 3TF
| Today | See what it's worth now |
| 10 Apr 2026 | £165,000 |
| 18 Dec 2020 | £160,000 |
No other historical records.
11, St Georges Quay, Lancaster LA1 1HL
| Today | See what it's worth now |
| 9 Apr 2026 | £110,000 |
| 24 Apr 2008 | £145,500 |
20, Equitable House, Bulk Street, Lancaster LA1 1GX
| Today | See what it's worth now |
| 8 Apr 2026 | £78,000 |
No other historical records.
24, Victoria Avenue, Lancaster LA1 4SY
| Today | See what it's worth now |
| 8 Apr 2026 | £225,000 |
| 22 Jul 2019 | £162,000 |
65, Windermere Road, Lancaster LA1 3EZ
| Today | See what it's worth now |
| 2 Apr 2026 | £235,000 |
| 23 Sep 2020 | £191,000 |
2, Severn Court, Morecambe LA3 3ST
| Today | See what it's worth now |
| 31 Mar 2026 | £210,000 |
| 18 Aug 2000 | £60,000 |
58, Barton Road, Lancaster LA1 4EP
| Today | See what it's worth now |
| 31 Mar 2026 | £365,000 |
| 20 May 2022 | £325,000 |
4, Broadway, Lancaster LA1 2BU
| Today | See what it's worth now |
| 31 Mar 2026 | £120,000 |
| 21 Nov 2011 | £83,000 |
Flat 27, 142 Williamson Court, Greaves Road, Lancaster LA1 4AR
| Today | See what it's worth now |
| 30 Mar 2026 | £40,000 |
| 23 Jan 2017 | £184,999 |
No other historical records.
185, Bowerham Road, Lancaster LA1 4HT

| Today | See what it's worth now |
| 27 Mar 2026 | £190,000 |
| 14 May 1999 | £46,000 |
No other historical records.
50, New Quay Road, Lancaster LA1 5UZ
| Today | See what it's worth now |
| 27 Mar 2026 | £292,500 |
| 1 May 2015 | £219,995 |
No other historical records.
21, Barton Road, Lancaster LA1 4ER
| Today | See what it's worth now |
| 27 Mar 2026 | £317,000 |
| 10 Sep 1999 | £74,000 |
No other historical records.
23, Cranwell Avenue, Lancaster LA1 4HW
| Today | See what it's worth now |
| 27 Mar 2026 | £285,000 |
| 28 Feb 2020 | £175,000 |
No other historical records.
8, Kershaw Drive, Lancaster LA1 3FY
| Today | See what it's worth now |
| 23 Mar 2026 | £315,000 |
| 9 Aug 2019 | £225,000 |
28, Emerson Street, Lancaster LA1 4EH
| Today | See what it's worth now |
| 23 Mar 2026 | £130,000 |
| 3 Sep 2010 | £85,000 |
No other historical records.
183, Bowerham Road, Lancaster LA1 4HT
| Today | See what it's worth now |
| 23 Mar 2026 | £192,000 |
| 21 Aug 2017 | £155,000 |
4, Primrose Court, Primrose Street, Lancaster LA1 3BF

| Today | See what it's worth now |
| 20 Mar 2026 | £175,000 |
| 13 Jul 2021 | £131,500 |
25, Edenvale Crescent, Lancaster LA1 2NW
| Today | See what it's worth now |
| 20 Mar 2026 | £175,500 |
| 22 Jul 2022 | £152,000 |
Source Acknowledgement: © Crown copyright. England and Wales house price data is publicly available information produced by the HM Land Registry.This material was last updated on 9 July 2026. It covers the period from 1 January 1995 to 30 April 2026 and contains property transactions which have been registered during that period. Contains HM Land Registry data © Crown copyright and database right 2026. This data is licensed under the Open Government Licence v3.0.
Disclaimer: Rightmove.co.uk provides this HM Land Registry data "as is". The burden for fitness of the data relies completely with the user and is provided for informational purposes only. No warranty, express or implied, is given relating to the accuracy of content of the HM Land Registry data and Rightmove does not accept any liability for error or omission. If you have found an error with the data or need further information please contact HM Land Registry.
Permitted Use: Viewers of this Information are granted permission to access this Crown copyright material and to download it onto electronic, magnetic, optical or similar storage media provided that such activities are for private research, study or in-house use only. Any other use of the material requires the formal written permission of Land Registry which can be requested from us, and is subject to an additional licence and associated charge.
Rightmove takes no liability for your use of, or reliance on, Rightmove's Instant Valuation due to the limitations of our tracking tool listed here. Use of this tool is taken entirely at your own risk. All rights reserved.