
House Prices in Langbridge
House prices in Langbridge have an overall average of £331,282 over the last year.
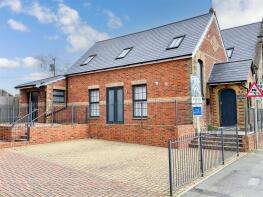
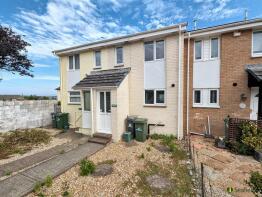
The majority of properties sold in Langbridge during the last year were detached properties, selling for an average price of £412,032. Semi-detached properties sold for an average of £259,050, with terraced properties fetching £204,667.
Overall, the historical sold prices in Langbridge over the last year were 3% up on the previous year and 2% down on the 2022 peak of £339,388.
Properties Sold
1, Clearways, Newport Road, Apse Heath, Sandown PO36 0JR
| Today | See what it's worth now |
| 30 May 2025 | £210,000 |
| 19 Dec 2014 | £155,000 |
9, Webster Way, Sandown PO36 0HS
| Today | See what it's worth now |
| 20 May 2025 | £445,189 |
| 13 Mar 2017 | £330,000 |
No other historical records.
66, New Road, Sandown PO36 0AQ
| Today | See what it's worth now |
| 2 May 2025 | £308,000 |
| 11 Apr 2012 | £225,000 |
112, New Road, Sandown PO36 0AB
| Today | See what it's worth now |
| 25 Apr 2025 | £252,500 |
| 5 Oct 2001 | £35,000 |
No other historical records.
The Vestry, Newport Road, Apse Heath, Sandown PO36 0JR
| Today | See what it's worth now |
| 3 Apr 2025 | £285,000 |
| 29 Oct 2021 | £308,000 |
No other historical records.
Richmond, Youngwoods Way, Alverstone Garden Village, Sandown PO36 0HE
| Today | See what it's worth now |
| 12 Mar 2025 | £395,000 |
| 31 Aug 1995 | £113,000 |
No other historical records.
Flat 6, Winford Court, Forest Way, Sandown PO36 0JJ
| Today | See what it's worth now |
| 12 Mar 2025 | £131,000 |
| 15 Feb 2019 | £93,000 |
1, Lower Furlongs, Brading, Sandown PO36 0DX
| Today | See what it's worth now |
| 10 Mar 2025 | £208,000 |
| 19 Jun 2019 | £179,000 |
Stavordale, The Mall, Brading, Sandown PO36 0BU
| Today | See what it's worth now |
| 20 Feb 2025 | £204,000 |
| 12 Mar 2010 | £140,000 |
5, Cross Street, Sandown PO36 0DL
| Today | See what it's worth now |
| 20 Feb 2025 | £182,000 |
| 23 Nov 2007 | £141,000 |
1, Fernside, The Mall, Brading, Sandown PO36 0BP

| Today | See what it's worth now |
| 14 Feb 2025 | £205,000 |
| 17 May 2013 | £153,000 |
29, New Road, Brading PO36 0AH
| Today | See what it's worth now |
| 13 Feb 2025 | £395,000 |
No other historical records.
4, High Street, Sandown PO36 0DG
| Today | See what it's worth now |
| 7 Feb 2025 | £175,000 |
| 20 Feb 2024 | £200,000 |
50, Forest Way, Sandown PO36 0JW
| Today | See what it's worth now |
| 6 Feb 2025 | £385,000 |
| 31 Jan 1997 | £73,500 |
No other historical records.
3, Queens Drive, Sandown PO36 0JB
| Today | See what it's worth now |
| 3 Feb 2025 | £245,000 |
| 12 Jun 2006 | £199,950 |
10, Ventnor Road, Sandown PO36 0JT

| Today | See what it's worth now |
| 31 Jan 2025 | £335,000 |
| 13 Jul 2021 | £260,000 |
Sunny Patch, Alverstone Road, Sandown PO36 0LE
| Today | See what it's worth now |
| 20 Jan 2025 | £407,500 |
| 22 Sep 2020 | £371,000 |
Panorama, Alverstone Road, Sandown PO36 0LH


| Today | See what it's worth now |
| 19 Dec 2024 | £310,000 |
| 6 Sep 2001 | £60,000 |
No other historical records.
20, Youngwoods Copse, Sandown PO36 0HJ
| Today | See what it's worth now |
| 19 Dec 2024 | £377,000 |
| 15 Apr 2019 | £281,500 |
No other historical records.
2, Hillerdale, Wrax Road, Sandown PO36 0DD
| Today | See what it's worth now |
| 18 Dec 2024 | £303,000 |
| 29 Apr 2022 | £225,000 |
Aspens, Newport Road, Apse Heath, Sandown PO36 0LS
| Today | See what it's worth now |
| 18 Dec 2024 | £489,950 |
| 30 Oct 2017 | £323,000 |
Rowborough Manor, Beaper Shute, Sandown PO36 0AZ
| Today | See what it's worth now |
| 16 Dec 2024 | £900,000 |
| 25 Jan 2002 | £360,000 |
No other historical records.
Flat 3, Alverstone Court, Woods Drive, Sandown PO36 0PR
| Today | See what it's worth now |
| 5 Dec 2024 | £140,000 |
| 25 May 2012 | £109,000 |
19, Park Way, Sandown PO36 0LN
| Today | See what it's worth now |
| 5 Dec 2024 | £235,000 |
| 13 May 2022 | £205,950 |
Westmeath, Winford Road, Sandown PO36 0LZ
| Today | See what it's worth now |
| 2 Dec 2024 | £452,500 |
| 17 Dec 1996 | £75,000 |
No other historical records.
Get ready with a Mortgage in Principle
- Personalised result in just 20 minutes
- Find out how much you can borrow
- Get viewings faster with agents
- No impact on your credit score
What's your property worth?
Source Acknowledgement: © Crown copyright. England and Wales house price data is publicly available information produced by the HM Land Registry.This material was last updated on 6 August 2025. It covers the period from 1 January 1995 to 30 June 2025 and contains property transactions which have been registered during that period. Contains HM Land Registry data © Crown copyright and database right 2025. This data is licensed under the Open Government Licence v3.0.
Disclaimer: Rightmove.co.uk provides this HM Land Registry data "as is". The burden for fitness of the data relies completely with the user and is provided for informational purposes only. No warranty, express or implied, is given relating to the accuracy of content of the HM Land Registry data and Rightmove does not accept any liability for error or omission. If you have found an error with the data or need further information please contact HM Land Registry.
Permitted Use: Viewers of this Information are granted permission to access this Crown copyright material and to download it onto electronic, magnetic, optical or similar storage media provided that such activities are for private research, study or in-house use only. Any other use of the material requires the formal written permission of Land Registry which can be requested from us, and is subject to an additional licence and associated charge.
Map data ©OpenStreetMap contributors.
Rightmove takes no liability for your use of, or reliance on, Rightmove's Instant Valuation due to the limitations of our tracking tool listed here. Use of this tool is taken entirely at your own risk. All rights reserved.