
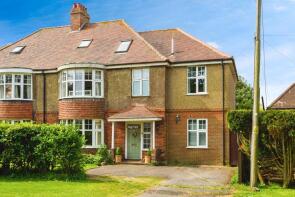
House Prices in Langdon
House prices in Langdon have an overall average of £351,119 over the last year.
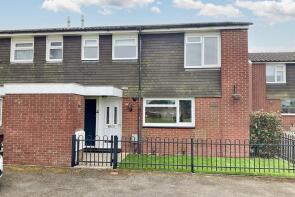
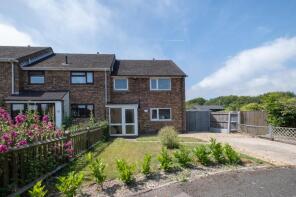
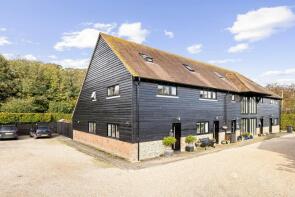
The majority of properties sold in Langdon during the last year were terraced properties, selling for an average price of £321,375. Detached properties sold for an average of £417,000, with semi-detached properties fetching £338,333.
Overall, the historical sold prices in Langdon over the last year were 13% down on the previous year and 18% down on the 2022 peak of £426,762.
Properties Sold
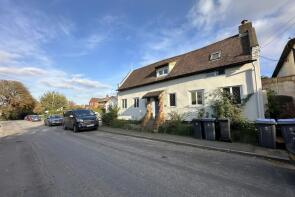
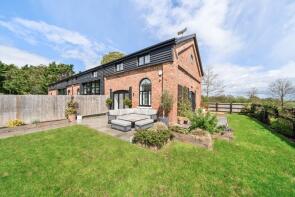
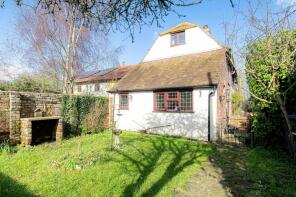
Ember Cottage, Dover Road, Dover CT15 5EW
| Today | See what it's worth now |
| 10 Apr 2026 | £310,000 |
| 31 Jul 2015 | £238,000 |
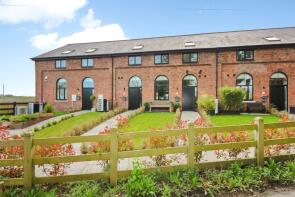
1, The Old Engine Shed, Singledge Lane, Dover CT15 5AG
| Today | See what it's worth now |
| 3 Mar 2026 | £750,000 |
| 14 May 2021 | £410,000 |
No other historical records.
4, The Old Engine Shed, Singledge Lane, Dover CT15 5AG
| Today | See what it's worth now |
| 30 Jan 2026 | £310,000 |
| 8 Apr 2022 | £285,000 |
No other historical records.
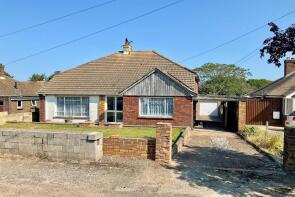
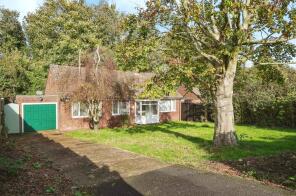
Deepdene, Downs Road, East Studdal CT15 5BZ
| Today | See what it's worth now |
| 12 Jan 2026 | £287,000 |
No other historical records.
4, Martin Dale Crescent, Martin Mill CT15 5JU
| Today | See what it's worth now |
| 18 Dec 2025 | £385,000 |
No other historical records.
185, Kohima Place, Dover CT15 5LJ

| Today | See what it's worth now |
| 12 Dec 2025 | £220,000 |
| 15 Jul 2013 | £110,000 |
238, Anzio Crescent, Dover CT15 5LZ
| Today | See what it's worth now |
| 21 Nov 2025 | £202,500 |
| 24 Oct 2007 | £125,000 |
Highview, Dover Road, Dover CT15 5EH
| Today | See what it's worth now |
| 6 Nov 2025 | £500,000 |
| 29 Aug 1997 | £90,000 |
No other historical records.
249, Anzio Crescent, Dover CT15 5LZ
| Today | See what it's worth now |
| 31 Oct 2025 | £235,000 |
| 17 Sep 1999 | £40,950 |
No other historical records.
10, Prescott Close, Dover CT15 5NB
| Today | See what it's worth now |
| 24 Oct 2025 | £283,000 |
| 1 Feb 2021 | £217,000 |
19, Downs Close, Dover CT15 5BY

| Today | See what it's worth now |
| 15 Oct 2025 | £280,000 |
| 23 Jun 2017 | £225,000 |
6, Church Farm Mews, The Street, Dover CT15 5FE
| Today | See what it's worth now |
| 10 Oct 2025 | £374,000 |
| 23 Nov 2010 | £249,950 |
No other historical records.
5, The Old Engine Shed, Singledge Lane, Dover CT15 5AG
| Today | See what it's worth now |
| 10 Oct 2025 | £450,000 |
| 30 Jun 2021 | £395,000 |
No other historical records.
164, Namur Place, Dover CT15 5LX
| Today | See what it's worth now |
| 29 Sep 2025 | £270,000 |
| 31 May 2001 | £64,950 |
No other historical records.
135, Lucknow Close, Dover CT15 5LH
| Today | See what it's worth now |
| 26 Sep 2025 | £252,000 |
| 5 Jul 2001 | £62,450 |
No other historical records.
4, St Martins Road, Guston CT15 5EL
| Today | See what it's worth now |
| 29 Aug 2025 | £220,000 |
No other historical records.
Bay Tree House, St Martins Road, Guston CT15 5EL

| Today | See what it's worth now |
| 26 Aug 2025 | £460,000 |
No other historical records.
21, Prescott Close, Dover CT15 5NB
| Today | See what it's worth now |
| 22 Aug 2025 | £235,000 |
| 7 Sep 2018 | £200,000 |
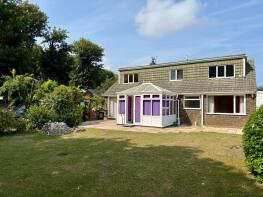
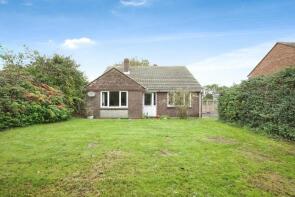
Willkommen, Downs Road, East Studdal CT15 5BX
| Today | See what it's worth now |
| 18 Aug 2025 | £290,000 |
| 11 Jul 1997 | £69,000 |
No other historical records.
Glendale, Strakers Hill, Dover CT15 5BS

| Today | See what it's worth now |
| 7 Aug 2025 | £420,000 |
| 29 Oct 2004 | £245,000 |
Hillcrest, Strakers Hill, Dover CT15 5BS
| Today | See what it's worth now |
| 16 Jul 2025 | £640,000 |
| 26 Jul 2002 | £186,000 |
Brompton House, The Street, Dover CT15 5ET
| Today | See what it's worth now |
| 27 Jun 2025 | £399,000 |
| 6 Jun 2000 | £165,000 |
Lynton Cottage, Chapel Lane, Ashley CT15 5HY
| Today | See what it's worth now |
| 30 May 2025 | £240,000 |
No other historical records.
Source Acknowledgement: © Crown copyright. England and Wales house price data is publicly available information produced by the HM Land Registry.This material was last updated on 9 July 2026. It covers the period from 1 January 1995 to 30 April 2026 and contains property transactions which have been registered during that period. Contains HM Land Registry data © Crown copyright and database right 2026. This data is licensed under the Open Government Licence v3.0.
Disclaimer: Rightmove.co.uk provides this HM Land Registry data "as is". The burden for fitness of the data relies completely with the user and is provided for informational purposes only. No warranty, express or implied, is given relating to the accuracy of content of the HM Land Registry data and Rightmove does not accept any liability for error or omission. If you have found an error with the data or need further information please contact HM Land Registry.
Permitted Use: Viewers of this Information are granted permission to access this Crown copyright material and to download it onto electronic, magnetic, optical or similar storage media provided that such activities are for private research, study or in-house use only. Any other use of the material requires the formal written permission of Land Registry which can be requested from us, and is subject to an additional licence and associated charge.
Rightmove takes no liability for your use of, or reliance on, Rightmove's Instant Valuation due to the limitations of our tracking tool listed here. Use of this tool is taken entirely at your own risk. All rights reserved.