
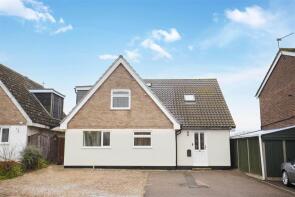
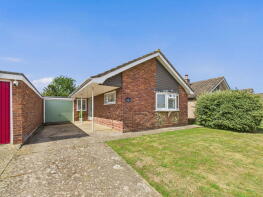
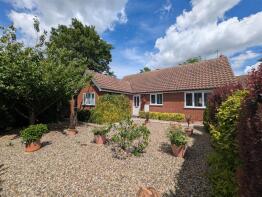
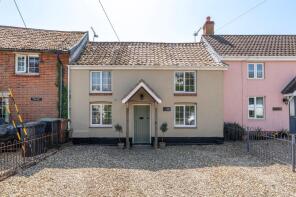
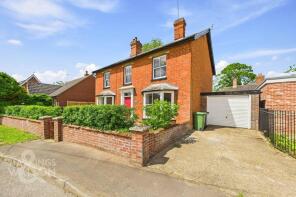
House Prices in Langmere Green
House prices in Langmere Green have an overall average of £353,309 over the last year.
The majority of properties sold in Langmere Green during the last year were detached properties, selling for an average price of £418,400. Semi-detached properties sold for an average of £272,211, with terraced properties fetching £363,500.
Overall, the historical sold prices in Langmere Green over the last year were 11% up on the previous year and 7% down on the 2023 peak of £381,412.
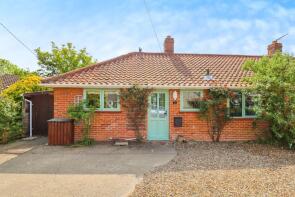
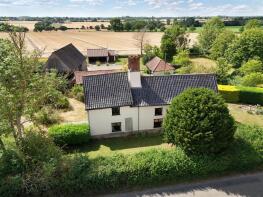
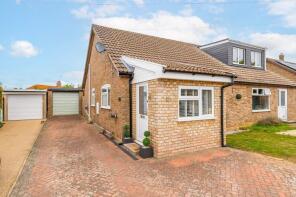
Properties Sold
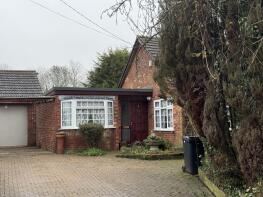
6, St Leonards Close, Diss IP21 4DW
| Today | See what it's worth now |
| 22 Apr 2026 | £373,000 |
| 15 Jul 2016 | £205,000 |
No other historical records.
1 South Wind, Goldsmith Way, Diss IP21 4QL
| Today | See what it's worth now |
| 31 Mar 2026 | £314,000 |
| 25 Aug 2017 | £222,500 |
11, Robinson Road, Diss IP21 4EF
| Today | See what it's worth now |
| 31 Mar 2026 | £340,000 |
| 30 May 2003 | £166,000 |
35a Forge Cottage, Low Street, Diss IP21 4AQ
| Today | See what it's worth now |
| 23 Mar 2026 | £283,000 |
| 11 Jun 2018 | £210,000 |
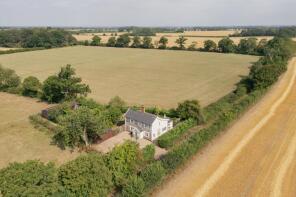
New Lodge, Stuston Lane, Diss IP21 4AF

| Today | See what it's worth now |
| 18 Mar 2026 | £468,000 |
| 25 Aug 2021 | £510,000 |
Cherry Trees, Dickleburgh Road, Diss IP21 4UB
| Today | See what it's worth now |
| 11 Mar 2026 | £350,000 |
| 19 Dec 2002 | £152,000 |
Mor Mor Cottage, Mormor Lane, Diss IP21 4JD
| Today | See what it's worth now |
| 24 Feb 2026 | £570,000 |
| 16 Sep 2021 | £612,000 |
Chestnut House, Norwich Road, Diss IP21 4NR
| Today | See what it's worth now |
| 18 Feb 2026 | £295,000 |
| 9 Jul 2019 | £225,000 |
8, Norwich Road, Diss IP21 4QU
| Today | See what it's worth now |
| 2 Feb 2026 | £273,000 |
| 7 Nov 2017 | £160,000 |
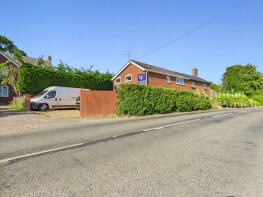
6, Hillcrest Court, Ipswich Road, Diss IP21 4YJ
| Today | See what it's worth now |
| 30 Jan 2026 | £100,000 |
| 2 Oct 2006 | £75,000 |
Pantiles, Stuston Lane, Stuston IP21 4AF
| Today | See what it's worth now |
| 30 Jan 2026 | £568,000 |
No other historical records.
Byfield House, The Maltings, Station Road, Diss IP21 4RU
| Today | See what it's worth now |
| 28 Jan 2026 | £540,000 |
| 16 Feb 2015 | £365,000 |
No other historical records.
2, North Farm Cottages, Kemps Road, Diss IP21 4YH
| Today | See what it's worth now |
| 16 Jan 2026 | £230,000 |
| 11 Jan 2002 | £120,000 |
No other historical records.
8, The Terrace, Norwich Road, Diss IP21 4DY
| Today | See what it's worth now |
| 9 Jan 2026 | £225,000 |
| 28 Jul 2000 | £55,000 |
No other historical records.
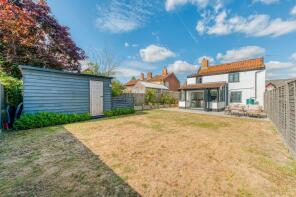
Waveney House, Lower Street, Diss IP21 4HL
| Today | See what it's worth now |
| 5 Jan 2026 | £630,000 |
| 29 Sep 2016 | £435,000 |
Hill View, Harleston Road, Diss IP21 4RT
| Today | See what it's worth now |
| 22 Dec 2025 | £253,000 |
| 30 Jul 2010 | £350,000 |
Vineyard Cottage, Mill Lane, Diss IP21 4XL
| Today | See what it's worth now |
| 10 Dec 2025 | £535,000 |
| 19 Dec 1996 | £58,000 |
No other historical records.
Cotswold Cottage, Old Bury Road, Stuston IP21 4AD
| Today | See what it's worth now |
| 9 Dec 2025 | £450,000 |
No other historical records.
The School Masters House, Station Road, Diss IP21 4QT
| Today | See what it's worth now |
| 9 Dec 2025 | £365,000 |
| 30 Oct 2019 | £275,000 |
No other historical records.
3, Mill Close, Diss IP21 4TQ
| Today | See what it's worth now |
| 4 Dec 2025 | £225,000 |
| 18 Jul 2019 | £193,500 |
No other historical records.
Hill Farm, Poppys Lane, Pulham Market IP21 4YL
| Today | See what it's worth now |
| 28 Nov 2025 | £695,000 |
No other historical records.
149, Burston Road, Dickleburgh IP21 4NP
| Today | See what it's worth now |
| 28 Nov 2025 | £475,000 |
| 13 Mar 2017 | £322,500 |
27, Limmer Avenue, Diss IP21 4PP
| Today | See what it's worth now |
| 28 Nov 2025 | £222,500 |
| 12 Nov 2021 | £175,000 |
Source Acknowledgement: © Crown copyright. England and Wales house price data is publicly available information produced by the HM Land Registry.This material was last updated on 9 July 2026. It covers the period from 1 January 1995 to 30 April 2026 and contains property transactions which have been registered during that period. Contains HM Land Registry data © Crown copyright and database right 2026. This data is licensed under the Open Government Licence v3.0.
Disclaimer: Rightmove.co.uk provides this HM Land Registry data "as is". The burden for fitness of the data relies completely with the user and is provided for informational purposes only. No warranty, express or implied, is given relating to the accuracy of content of the HM Land Registry data and Rightmove does not accept any liability for error or omission. If you have found an error with the data or need further information please contact HM Land Registry.
Permitted Use: Viewers of this Information are granted permission to access this Crown copyright material and to download it onto electronic, magnetic, optical or similar storage media provided that such activities are for private research, study or in-house use only. Any other use of the material requires the formal written permission of Land Registry which can be requested from us, and is subject to an additional licence and associated charge.
Rightmove takes no liability for your use of, or reliance on, Rightmove's Instant Valuation due to the limitations of our tracking tool listed here. Use of this tool is taken entirely at your own risk. All rights reserved.