
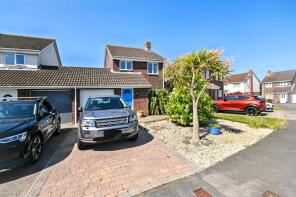
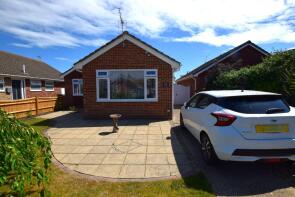
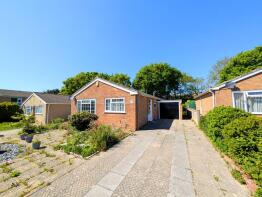
House Prices in Langney
House prices in Langney have an overall average of £278,410 over the last year.
The majority of properties sold in Langney during the last year were terraced properties, selling for an average price of £260,155. Semi-detached properties sold for an average of £283,207, with detached properties fetching £355,274.
Overall, the historical sold prices in Langney over the last year were 4% down on the previous year and 7% down on the 2022 peak of £300,952.
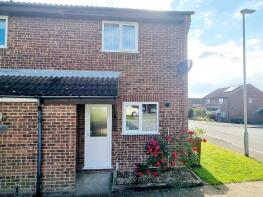
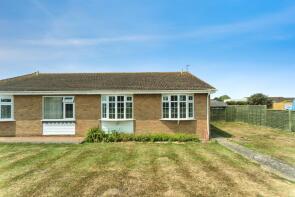
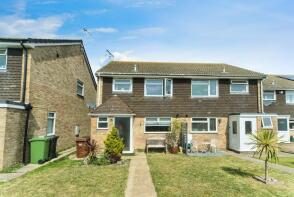
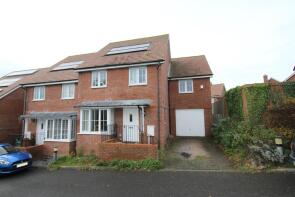
Properties Sold
1, Golding Road, Eastbourne BN23 7AW
| Today | See what it's worth now |
| 22 Apr 2026 | £365,000 |
| 22 Dec 2020 | £300,000 |
No other historical records.
76, Ashgate Road, Eastbourne BN23 7ES
| Today | See what it's worth now |
| 17 Apr 2026 | £210,000 |
| 15 Dec 2006 | £132,000 |
No other historical records.
24, St Anthonys Avenue, Eastbourne BN23 6LP
| Today | See what it's worth now |
| 16 Apr 2026 | £268,000 |
| 11 Jun 1999 | £81,000 |
47, Friday Street, Eastbourne BN23 8AR
| Today | See what it's worth now |
| 10 Apr 2026 | £235,000 |
| 18 Apr 2003 | £134,000 |
10, Bembridge Road, Eastbourne BN23 8DX
| Today | See what it's worth now |
| 10 Apr 2026 | £225,000 |
| 6 Apr 2000 | £63,000 |
No other historical records.
43, Tolkien Road, Eastbourne BN23 7AL
| Today | See what it's worth now |
| 2 Apr 2026 | £315,000 |
| 23 Jul 2004 | £164,950 |
122, Aylesbury Avenue, Eastbourne BN23 6EL
| Today | See what it's worth now |
| 2 Apr 2026 | £317,000 |
| 28 Mar 2008 | £208,500 |
No other historical records.
Flat 14, 12 16 Antrim Court, Pembury Road, Eastbourne BN23 7LU
| Today | See what it's worth now |
| 30 Mar 2026 | £115,000 |
| 15 May 2006 | £105,000 |
26, Carnforth Crescent, Eastbourne BN23 8NJ
| Today | See what it's worth now |
| 27 Mar 2026 | £365,000 |
| 13 Dec 2022 | £400,000 |
2, Avebury Mews, Eastbourne BN23 7FA
| Today | See what it's worth now |
| 27 Mar 2026 | £299,000 |
| 18 Mar 2021 | £284,950 |
No other historical records.
31, Faversham Road, Eastbourne BN23 7JL
| Today | See what it's worth now |
| 27 Mar 2026 | £240,000 |
No other historical records.
29, Kilpatrick Close, Eastbourne BN23 8HN
| Today | See what it's worth now |
| 20 Mar 2026 | £275,000 |
| 24 May 2023 | £260,000 |
6, Orchid Close, Eastbourne BN23 8DE
| Today | See what it's worth now |
| 18 Mar 2026 | £292,500 |
| 19 Jun 2017 | £230,000 |
No other historical records.
22, Grampian Close, Eastbourne BN23 8EP
| Today | See what it's worth now |
| 13 Mar 2026 | £345,000 |
| 29 May 1996 | £65,500 |
No other historical records.
24, Rise Park Gardens, Eastbourne BN23 7EY
| Today | See what it's worth now |
| 10 Mar 2026 | £418,000 |
| 27 Apr 2014 | £214,500 |
No other historical records.
14, Honeysuckle Close, Eastbourne BN23 8DA
| Today | See what it's worth now |
| 4 Mar 2026 | £300,000 |
| 4 Aug 2017 | £275,000 |
17 Durwin, Magpie Road, Eastbourne BN23 7RG
| Today | See what it's worth now |
| 2 Mar 2026 | £280,000 |
| 2 Jul 2010 | £184,000 |
No other historical records.
19, Chiltern Close, Eastbourne BN23 8HD
| Today | See what it's worth now |
| 27 Feb 2026 | £341,500 |
| 10 Sep 1997 | £80,000 |
No other historical records.
43, Great Cliffe Road, Eastbourne BN23 7BB
| Today | See what it's worth now |
| 27 Feb 2026 | £295,000 |
| 18 Jul 2014 | £156,950 |
62, Snowdon Close, Eastbourne BN23 8HZ
| Today | See what it's worth now |
| 27 Feb 2026 | £145,000 |
| 4 Aug 2022 | £155,000 |
35 Roman, Chiltern Close, Eastbourne BN23 8HD
| Today | See what it's worth now |
| 27 Feb 2026 | £405,000 |
| 15 Jun 2001 | £151,000 |
No other historical records.
9, Swanley Close, Eastbourne BN23 7JW

| Today | See what it's worth now |
| 26 Feb 2026 | £280,000 |
| 29 Oct 2014 | £170,000 |
No other historical records.
2, Elmwood Gardens, Eastbourne BN23 8JH
| Today | See what it's worth now |
| 23 Feb 2026 | £272,500 |
| 19 Dec 2012 | £165,000 |
Source Acknowledgement: © Crown copyright. England and Wales house price data is publicly available information produced by the HM Land Registry.This material was last updated on 9 July 2026. It covers the period from 1 January 1995 to 30 April 2026 and contains property transactions which have been registered during that period. Contains HM Land Registry data © Crown copyright and database right 2026. This data is licensed under the Open Government Licence v3.0.
Disclaimer: Rightmove.co.uk provides this HM Land Registry data "as is". The burden for fitness of the data relies completely with the user and is provided for informational purposes only. No warranty, express or implied, is given relating to the accuracy of content of the HM Land Registry data and Rightmove does not accept any liability for error or omission. If you have found an error with the data or need further information please contact HM Land Registry.
Permitted Use: Viewers of this Information are granted permission to access this Crown copyright material and to download it onto electronic, magnetic, optical or similar storage media provided that such activities are for private research, study or in-house use only. Any other use of the material requires the formal written permission of Land Registry which can be requested from us, and is subject to an additional licence and associated charge.
Rightmove takes no liability for your use of, or reliance on, Rightmove's Instant Valuation due to the limitations of our tracking tool listed here. Use of this tool is taken entirely at your own risk. All rights reserved.