
House Prices in Lanvean
House prices in Lanvean have an overall average of £345,450 over the last year.
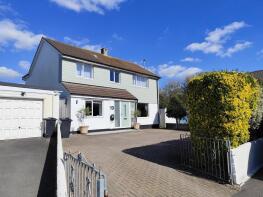
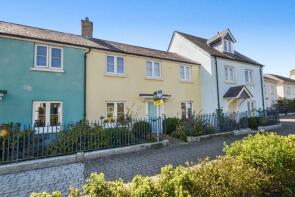
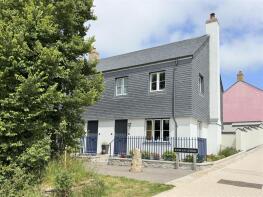
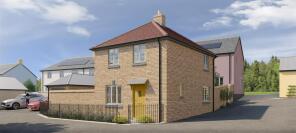
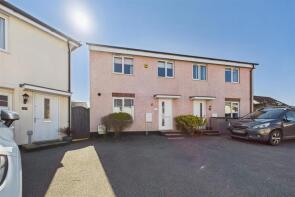
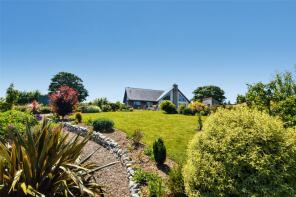
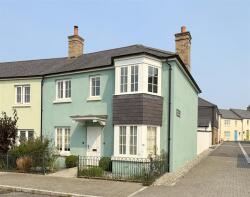
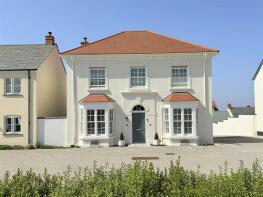
The majority of properties sold in Lanvean during the last year were detached properties, selling for an average price of £494,439. Semi-detached properties sold for an average of £297,888, with terraced properties fetching £262,909.
Overall, the historical sold prices in Lanvean over the last year were 14% down on the previous year and 17% down on the 2022 peak of £418,444.
Properties Sold
150, Bedowan Meadows, Tretherras, Newquay TR7 2TB
| Today | See what it's worth now |
| 20 Mar 2026 | £479,950 |
| 13 Apr 2018 | £186,000 |
50, Stret Kosti Veur Wartha, Nansledan, Newquay TR8 4SX
| Today | See what it's worth now |
| 18 Mar 2026 | £395,000 |
| 21 Oct 2022 | £468,000 |
No other historical records.
41, East Road, Newquay TR8 4LQ

| Today | See what it's worth now |
| 27 Feb 2026 | £465,000 |
| 13 Mar 2015 | £190,000 |
29, Quintrell Gardens, Newquay TR8 4LH
| Today | See what it's worth now |
| 27 Feb 2026 | £320,000 |
| 2 Nov 2015 | £190,000 |
100, Calshot Close, Newquay TR7 3HL
| Today | See what it's worth now |
| 27 Feb 2026 | £220,000 |
| 28 Sep 2011 | £130,000 |
No other historical records.
13 Avalon, Challis Avenue, Carloggas, Newquay TR8 4EJ
| Today | See what it's worth now |
| 25 Feb 2026 | £590,000 |
| 16 Sep 2014 | £303,000 |
64, Quintrell Road, Newquay TR7 3FJ
| Today | See what it's worth now |
| 16 Feb 2026 | £306,000 |
| 28 Apr 2017 | £240,000 |
No other historical records.
1, Kew An Lergh, Nansledan, Newquay TR8 4UZ
| Today | See what it's worth now |
| 23 Jan 2026 | £320,000 |
| 27 Mar 2024 | £314,950 |
No other historical records.
Gusti Veor House, Newquay TR8 4JU
| Today | See what it's worth now |
| 22 Jan 2026 | £495,000 |
No other historical records.
2, Lyons Court, Newquay TR7 3FF
| Today | See what it's worth now |
| 16 Jan 2026 | £305,000 |
| 7 Oct 2013 | £214,995 |
No other historical records.
Brynmor, Access To Trenance Estate, Trenance, Newquay TR8 4BZ
| Today | See what it's worth now |
| 6 Jan 2026 | £850,000 |
| 9 Oct 1998 | £100,000 |
No other historical records.
Gwel Teg, Bejowan Barns, Quintrell Downs TR8 4PA
| Today | See what it's worth now |
| 5 Jan 2026 | £730,000 |
No other historical records.
Ivy Cottage, Road From Trevarrian Hill To Tregurrian Hill, Tregurrian, Newquay TR8 4AD

| Today | See what it's worth now |
| 23 Dec 2025 | £1,467,525 |
| 25 May 2018 | £1,100,000 |
7, Stret Trystan, Nansledan, Newquay TR8 4FD
| Today | See what it's worth now |
| 19 Dec 2025 | £360,000 |
| 25 Sep 2018 | £275,000 |
No other historical records.
10, Gwarak Esels, Nansledan, Newquay TR8 4SD
| Today | See what it's worth now |
| 19 Dec 2025 | £485,000 |
| 21 Nov 2023 | £495,000 |
44, Stret Galahad, Nansledan, Newquay TR8 4TN
| Today | See what it's worth now |
| 18 Dec 2025 | £400,000 |
| 6 Mar 2025 | £399,950 |
No other historical records.
2, Howies Court, Road From Trevenna Cross To Bolingey Road, Trevenna Cross, Newquay TR8 4HB
| Today | See what it's worth now |
| 17 Dec 2025 | £80,000 |
| 14 Mar 2023 | £425,000 |
43, Cavendish Crescent, Newquay TR7 3DS
| Today | See what it's worth now |
| 15 Dec 2025 | £325,000 |
| 25 May 2018 | £221,500 |
5, Bownder Kolom, Nansledan, Newquay TR8 4RU
| Today | See what it's worth now |
| 15 Dec 2025 | £450,000 |
| 24 May 2019 | £375,000 |
No other historical records.
41, Figgy Road, Newquay TR8 4WB
| Today | See what it's worth now |
| 15 Dec 2025 | £287,000 |
| 14 Oct 2015 | £197,000 |
No other historical records.
Pleasant Streams, Tregurrian, Newquay TR8 4AD
| Today | See what it's worth now |
| 12 Dec 2025 | £750,000 |
No other historical records.
22, Quintrell Gardens, Newquay TR8 4LH
| Today | See what it's worth now |
| 12 Dec 2025 | £235,000 |
| 30 Mar 2016 | £151,000 |
No other historical records.
1, Garden Way, Newquay TR8 4LG
| Today | See what it's worth now |
| 12 Dec 2025 | £450,000 |
| 31 Jul 2008 | £232,000 |
Source Acknowledgement: © Crown copyright. England and Wales house price data is publicly available information produced by the HM Land Registry.This material was last updated on 15 May 2026. It covers the period from 1 January 1995 to 31 March 2026 and contains property transactions which have been registered during that period. Contains HM Land Registry data © Crown copyright and database right 2026. This data is licensed under the Open Government Licence v3.0.
Disclaimer: Rightmove.co.uk provides this HM Land Registry data "as is". The burden for fitness of the data relies completely with the user and is provided for informational purposes only. No warranty, express or implied, is given relating to the accuracy of content of the HM Land Registry data and Rightmove does not accept any liability for error or omission. If you have found an error with the data or need further information please contact HM Land Registry.
Permitted Use: Viewers of this Information are granted permission to access this Crown copyright material and to download it onto electronic, magnetic, optical or similar storage media provided that such activities are for private research, study or in-house use only. Any other use of the material requires the formal written permission of Land Registry which can be requested from us, and is subject to an additional licence and associated charge.
Map data ©OpenStreetMap contributors.
Rightmove takes no liability for your use of, or reliance on, Rightmove's Instant Valuation due to the limitations of our tracking tool listed here. Use of this tool is taken entirely at your own risk. All rights reserved.