
House Prices in Lee
House prices in Lee have an overall average of £283,409 over the last year.
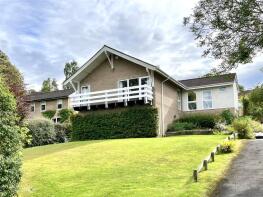
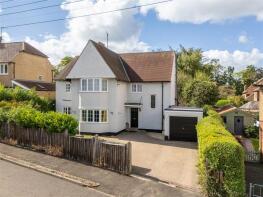
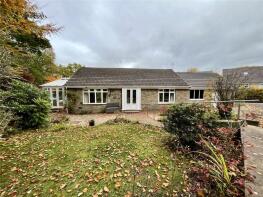
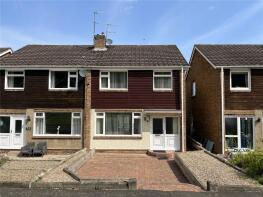
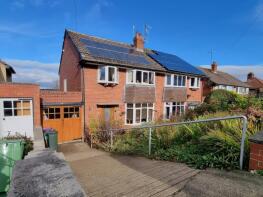
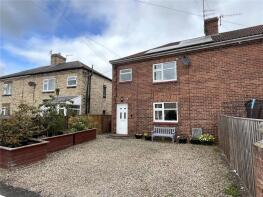
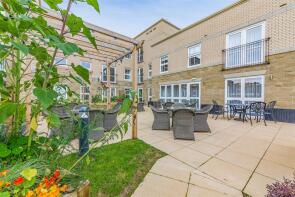
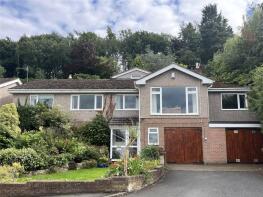
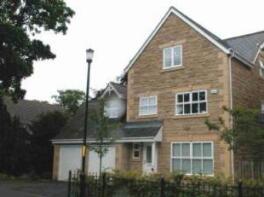
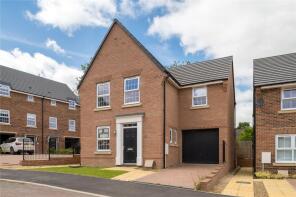
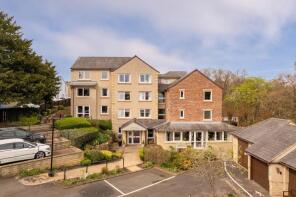
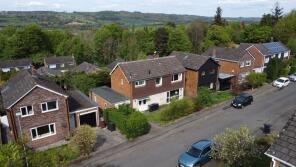
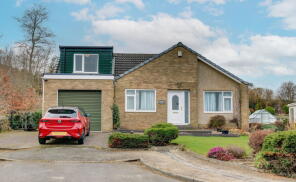
The majority of properties sold in Lee during the last year were detached properties, selling for an average price of £421,933. Flats sold for an average of £157,300, with semi-detached properties fetching £219,727.
Overall, the historical sold prices in Lee over the last year were 10% up on the previous year and 11% down on the 2022 peak of £319,745.
Properties Sold
28, Gibson Fields, Hexham NE46 1AS
| Today | See what it's worth now |
| 25 Mar 2026 | £340,000 |
| 28 Aug 2020 | £205,000 |
27, Hackwood Park, Hexham NE46 1AX
| Today | See what it's worth now |
| 4 Mar 2026 | £475,000 |
| 3 Sep 2010 | £285,000 |
No other historical records.
Stoneycroft, Elvaston Road, Hexham NE46 2HW
| Today | See what it's worth now |
| 30 Jan 2026 | £570,000 |
| 14 Oct 2020 | £455,000 |
1, The Paddock, Dipton Mill Road, Hexham NE46 1BP
| Today | See what it's worth now |
| 16 Jan 2026 | £410,000 |
| 5 May 2015 | £270,000 |
5, Edgewood, Hexham NE46 1LQ
| Today | See what it's worth now |
| 16 Jan 2026 | £238,000 |
| 21 Oct 2022 | £280,000 |
22, Bywell Avenue, Hexham NE46 1JA

| Today | See what it's worth now |
| 17 Dec 2025 | £255,000 |
| 25 May 2007 | £215,000 |
No other historical records.
27, Beaufront Avenue, Hexham NE46 1JD
| Today | See what it's worth now |
| 15 Dec 2025 | £210,000 |
No other historical records.
11, Argyle Terrace, Hexham NE46 1QB
| Today | See what it's worth now |
| 5 Dec 2025 | £115,000 |
| 14 Apr 2014 | £119,500 |
21, Peth Head, Hexham NE46 1HQ
| Today | See what it's worth now |
| 28 Nov 2025 | £180,000 |
| 21 Apr 2017 | £135,000 |
14, Hewson Court, Hexham NE46 1QF
| Today | See what it's worth now |
| 28 Nov 2025 | £235,000 |
| 10 Dec 2021 | £234,995 |
No other historical records.
11, Stainthorpe Court, Hexham NE46 1WY
| Today | See what it's worth now |
| 21 Nov 2025 | £135,000 |
| 1 Nov 2006 | £162,500 |
16, Kings Mews, Hexham NE46 1BG

| Today | See what it's worth now |
| 12 Nov 2025 | £80,000 |
| 3 Jan 2024 | £165,000 |
15, Hudshaw Gardens, Hexham NE46 1HY
| Today | See what it's worth now |
| 7 Nov 2025 | £365,000 |
No other historical records.
4, Gibson Fields, Hexham NE46 1AS
| Today | See what it's worth now |
| 31 Oct 2025 | £610,000 |
| 21 Jul 2003 | £317,500 |
8, Kings Mews, Hexham NE46 1BG
| Today | See what it's worth now |
| 24 Oct 2025 | £180,000 |
| 11 Dec 2020 | £150,000 |
48, Hornbeam Crescent, Woodland Rise, Hexham NE46 1WJ
| Today | See what it's worth now |
| 22 Oct 2025 | £280,000 |
| 4 May 2021 | £250,000 |
36, Abbey Court, Hexham NE46 1RN
| Today | See what it's worth now |
| 17 Oct 2025 | £112,000 |
| 15 Dec 2021 | £91,000 |
6, Long Close, Hexham NE46 1AW

| Today | See what it's worth now |
| 17 Oct 2025 | £155,000 |
| 21 Mar 2016 | £155,000 |
5, Monks Meadows, Hexham NE46 1LF
| Today | See what it's worth now |
| 3 Oct 2025 | £270,000 |
| 6 Nov 2023 | £315,000 |
6, Quarry Edge, Fellside, Hexham NE46 1RB
| Today | See what it's worth now |
| 29 Sep 2025 | £360,000 |
No other historical records.
25a, Hallstile Bank, Hexham NE46 3PQ
| Today | See what it's worth now |
| 24 Sep 2025 | £178,900 |
| 7 Mar 2025 | £177,000 |
8, Dean Street, Hexham NE46 1HG
| Today | See what it's worth now |
| 22 Sep 2025 | £225,000 |
No other historical records.
4, Eldon Road, Hexham NE46 1LJ
| Today | See what it's worth now |
| 19 Sep 2025 | £289,000 |
| 9 Oct 2015 | £198,436 |
Source Acknowledgement: © Crown copyright. England and Wales house price data is publicly available information produced by the HM Land Registry.This material was last updated on 15 May 2026. It covers the period from 1 January 1995 to 31 March 2026 and contains property transactions which have been registered during that period. Contains HM Land Registry data © Crown copyright and database right 2026. This data is licensed under the Open Government Licence v3.0.
Disclaimer: Rightmove.co.uk provides this HM Land Registry data "as is". The burden for fitness of the data relies completely with the user and is provided for informational purposes only. No warranty, express or implied, is given relating to the accuracy of content of the HM Land Registry data and Rightmove does not accept any liability for error or omission. If you have found an error with the data or need further information please contact HM Land Registry.
Permitted Use: Viewers of this Information are granted permission to access this Crown copyright material and to download it onto electronic, magnetic, optical or similar storage media provided that such activities are for private research, study or in-house use only. Any other use of the material requires the formal written permission of Land Registry which can be requested from us, and is subject to an additional licence and associated charge.
Rightmove takes no liability for your use of, or reliance on, Rightmove's Instant Valuation due to the limitations of our tracking tool listed here. Use of this tool is taken entirely at your own risk. All rights reserved.