
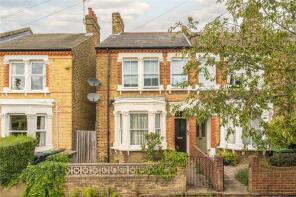
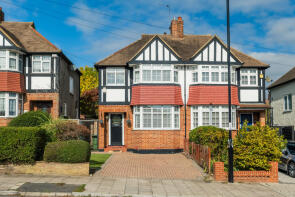
House Prices in Lee
House prices in Lee have an overall average of £584,021 over the last year.
The majority of properties sold in Lee during the last year were terraced properties, selling for an average price of £666,419. Flats sold for an average of £350,303, with semi-detached properties fetching £732,418.
Overall, the historical sold prices in Lee over the last year were 7% up on the previous year and 6% up on the 2023 peak of £553,308.
Properties Sold
17, Exford Road, London SE12 9HD
| Today | See what it's worth now |
| 24 Apr 2026 | £535,000 |
| 31 Oct 2007 | £308,000 |
66, Mottingham Lane, London SE12 9AW
| Today | See what it's worth now |
| 17 Apr 2026 | £840,000 |
| 5 Sep 1997 | £137,500 |
No other historical records.
19, Murillo Road, London SE13 5QF
| Today | See what it's worth now |
| 9 Apr 2026 | £765,000 |
| 22 Feb 2016 | £700,000 |
46, Senlac Road, London SE12 9NB
| Today | See what it's worth now |
| 31 Mar 2026 | £525,000 |
| 10 Aug 2005 | £243,000 |
No other historical records.
44, Effingham Road, London SE12 8NU
| Today | See what it's worth now |
| 31 Mar 2026 | £315,000 |
| 8 Jan 2007 | £465,000 |
No other historical records.
10, Pragnell Road, London SE12 0LF

| Today | See what it's worth now |
| 30 Mar 2026 | £635,000 |
| 15 Dec 2017 | £430,000 |
No other historical records.
Flat 4, 3 Angel Villas, Weigall Road, London SE12 8HE
| Today | See what it's worth now |
| 27 Mar 2026 | £415,000 |
| 8 Feb 2021 | £425,000 |
No other historical records.
37, Gavestone Road, London SE12 9BP
| Today | See what it's worth now |
| 26 Mar 2026 | £350,000 |
| 3 Dec 2004 | £167,000 |
No other historical records.
39, Old Road, London SE13 5SU
| Today | See what it's worth now |
| 25 Mar 2026 | £435,000 |
| 20 Mar 2015 | £225,000 |
45, Bramdean Crescent, London SE12 0UJ
| Today | See what it's worth now |
| 20 Mar 2026 | £487,725 |
| 11 Apr 2002 | £165,000 |
132, Marvels Lane, Grove Park, London SE12 9PG

| Today | See what it's worth now |
| 20 Mar 2026 | £200,000 |
| 29 Nov 2002 | £65,000 |
33, Upwood Road, London SE12 8AE
| Today | See what it's worth now |
| 20 Mar 2026 | £850,000 |
No other historical records.
Flat 1, 364, Lee High Road, London SE12 8RS
| Today | See what it's worth now |
| 19 Mar 2026 | £322,500 |
| 3 Jul 2020 | £325,010 |
4, Baring Close, London SE12 0UN
| Today | See what it's worth now |
| 13 Mar 2026 | £282,000 |
No other historical records.
64, Mottingham Lane, London SE12 9AW
| Today | See what it's worth now |
| 13 Mar 2026 | £960,000 |
| 24 Jun 2016 | £525,000 |
Flat C, James Court, Lampmead Road, London SE12 8QJ
| Today | See what it's worth now |
| 13 Mar 2026 | £235,000 |
| 27 Aug 2013 | £232,000 |
No other historical records.
2, Lambscroft Avenue, Grove Park, London SE9 4NZ
| Today | See what it's worth now |
| 13 Mar 2026 | £365,000 |
| 6 Oct 2015 | £262,000 |
First Floor Flat, 41, Leyland Road, London SE12 8DS
| Today | See what it's worth now |
| 12 Mar 2026 | £425,000 |
| 3 Jun 2016 | £410,000 |
Flat 12, Paxton Court, Marvels Lane, Grove Park, London SE12 9QQ
| Today | See what it's worth now |
| 9 Mar 2026 | £120,000 |
| 16 Dec 2021 | £215,000 |
33, Senlac Road, London SE12 9NB
| Today | See what it's worth now |
| 6 Mar 2026 | £500,000 |
| 26 Jun 2000 | £146,000 |
12, Stoneycroft Close, London SE12 0SL
| Today | See what it's worth now |
| 4 Mar 2026 | £335,000 |
| 27 Jan 2017 | £280,000 |
147, Baring Road, London SE12 0LA
| Today | See what it's worth now |
| 27 Feb 2026 | £593,000 |
| 28 Jun 1996 | £110,000 |
No other historical records.
53, Stoneycroft Close, London SE12 0SN
| Today | See what it's worth now |
| 27 Feb 2026 | £335,000 |
| 28 Jun 2019 | £299,950 |
Source Acknowledgement: © Crown copyright. England and Wales house price data is publicly available information produced by the HM Land Registry.This material was last updated on 9 July 2026. It covers the period from 1 January 1995 to 30 April 2026 and contains property transactions which have been registered during that period. Contains HM Land Registry data © Crown copyright and database right 2026. This data is licensed under the Open Government Licence v3.0.
Disclaimer: Rightmove.co.uk provides this HM Land Registry data "as is". The burden for fitness of the data relies completely with the user and is provided for informational purposes only. No warranty, express or implied, is given relating to the accuracy of content of the HM Land Registry data and Rightmove does not accept any liability for error or omission. If you have found an error with the data or need further information please contact HM Land Registry.
Permitted Use: Viewers of this Information are granted permission to access this Crown copyright material and to download it onto electronic, magnetic, optical or similar storage media provided that such activities are for private research, study or in-house use only. Any other use of the material requires the formal written permission of Land Registry which can be requested from us, and is subject to an additional licence and associated charge.
Rightmove takes no liability for your use of, or reliance on, Rightmove's Instant Valuation due to the limitations of our tracking tool listed here. Use of this tool is taken entirely at your own risk. All rights reserved.