
House Prices in Lilliput
House prices in Lilliput have an overall average of £652,114 over the last year.
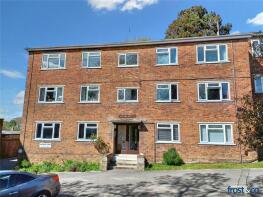
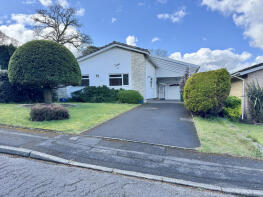
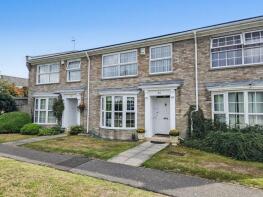
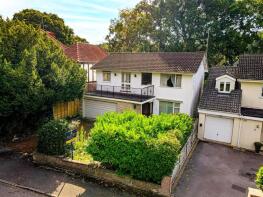
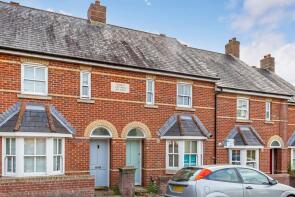
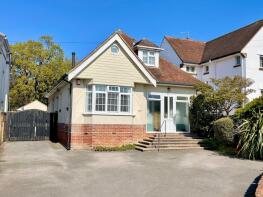
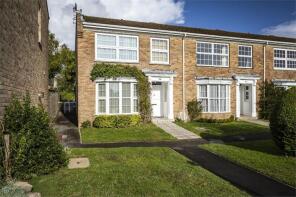
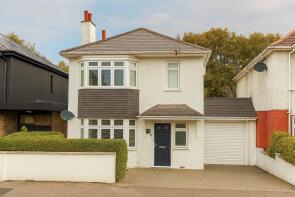
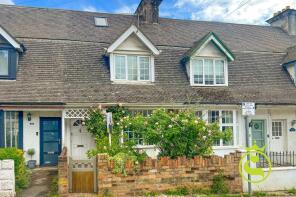
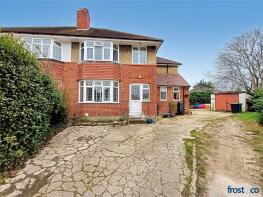
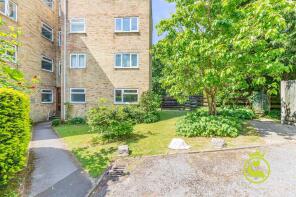
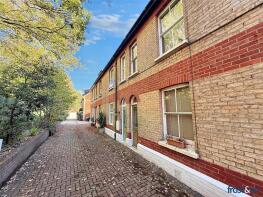
The majority of properties sold in Lilliput during the last year were detached properties, selling for an average price of £933,170. Flats sold for an average of £390,486, with semi-detached properties fetching £599,000.
Overall, the historical sold prices in Lilliput over the last year were 4% down on the previous year and 17% down on the 2022 peak of £782,603.
Properties Sold
5, 29 33 Westbury Court, Bournemouth Road, Poole BH14 0EH
| Today | See what it's worth now |
| 17 Apr 2026 | £210,000 |
| 2 Nov 2018 | £215,000 |
4, Potters Way, Poole BH14 8QG
| Today | See what it's worth now |
| 10 Apr 2026 | £592,500 |
| 30 May 2003 | £280,000 |
No other historical records.
29, Copeland Drive, Poole BH14 8NR
| Today | See what it's worth now |
| 10 Apr 2026 | £475,625 |
| 18 Mar 2002 | £200,000 |
16, Brownsea View Avenue, Poole BH14 8LQ
| Today | See what it's worth now |
| 1 Apr 2026 | £718,000 |
No other historical records.
11, Conifer Avenue, Poole BH14 8RT
| Today | See what it's worth now |
| 30 Mar 2026 | £455,000 |
| 6 Dec 2002 | £229,250 |
39, Brownsea View Avenue, Poole BH14 8LG
| Today | See what it's worth now |
| 26 Mar 2026 | £925,000 |
| 22 Jun 2015 | £1,027,250 |
Flat 16, 32 Harbour Prospect, Hurst Hill, Poole BH14 8LF
| Today | See what it's worth now |
| 25 Mar 2026 | £217,000 |
| 29 Jun 2018 | £255,000 |
83, Wedgwood Drive, Poole BH14 8EU
| Today | See what it's worth now |
| 23 Mar 2026 | £545,000 |
| 5 Nov 2020 | £350,000 |
16, Doulton Gardens, Poole BH14 8RG
| Today | See what it's worth now |
| 10 Mar 2026 | £415,000 |
| 1 Oct 2020 | £390,000 |
38, Britannia Road, Poole BH14 8BB
| Today | See what it's worth now |
| 10 Mar 2026 | £685,000 |
| 17 May 2018 | £440,000 |
14, Pottery Road, Poole BH14 8RF

| Today | See what it's worth now |
| 9 Mar 2026 | £700,000 |
| 27 May 2021 | £470,000 |
16, Pottery Road, Poole BH14 8RF
| Today | See what it's worth now |
| 9 Mar 2026 | £460,000 |
No other historical records.
Flat 3, 3, Powell Road, Poole BH14 8SG
| Today | See what it's worth now |
| 5 Mar 2026 | £445,000 |
| 11 Jun 2021 | £445,000 |
76, South Western Crescent, Poole BH14 8RS
| Today | See what it's worth now |
| 2 Mar 2026 | £515,000 |
| 25 May 2012 | £320,000 |
1, 11 Powell Lodge, Powell Road, Poole BH14 8SG

| Today | See what it's worth now |
| 27 Feb 2026 | £740,000 |
| 25 Feb 2022 | £435,000 |
15, Parr Street, Poole BH14 0JX
| Today | See what it's worth now |
| 27 Feb 2026 | £310,000 |
| 18 Nov 2011 | £212,000 |
253, Sandbanks Road, Poole BH14 8EY
| Today | See what it's worth now |
| 27 Feb 2026 | £730,000 |
| 19 Aug 2002 | £317,500 |
77, Pottery Road, Poole BH14 8RD

| Today | See what it's worth now |
| 26 Feb 2026 | £575,000 |
| 24 May 1996 | £81,500 |
No other historical records.
98, Wedgwood Drive, Poole BH14 8EX
| Today | See what it's worth now |
| 26 Feb 2026 | £485,000 |
| 21 Feb 2003 | £250,000 |
No other historical records.
16, Sherwood Avenue, Poole BH14 8DL
| Today | See what it's worth now |
| 23 Feb 2026 | £670,000 |
| 27 Jul 2006 | £342,000 |
1, 387 Witley, Sandbanks Road, Poole BH14 8HR

| Today | See what it's worth now |
| 19 Feb 2026 | £650,000 |
| 29 Jul 2022 | £810,000 |
47, Salterns Road, Poole BH14 8BL
| Today | See what it's worth now |
| 18 Feb 2026 | £402,000 |
| 30 Apr 2015 | £340,000 |
13, Worthington Crescent, Poole BH14 8BW
| Today | See what it's worth now |
| 16 Feb 2026 | £565,000 |
| 1 Nov 2019 | £462,000 |
No other historical records.
Source Acknowledgement: © Crown copyright. England and Wales house price data is publicly available information produced by the HM Land Registry.This material was last updated on 9 July 2026. It covers the period from 1 January 1995 to 30 April 2026 and contains property transactions which have been registered during that period. Contains HM Land Registry data © Crown copyright and database right 2026. This data is licensed under the Open Government Licence v3.0.
Disclaimer: Rightmove.co.uk provides this HM Land Registry data "as is". The burden for fitness of the data relies completely with the user and is provided for informational purposes only. No warranty, express or implied, is given relating to the accuracy of content of the HM Land Registry data and Rightmove does not accept any liability for error or omission. If you have found an error with the data or need further information please contact HM Land Registry.
Permitted Use: Viewers of this Information are granted permission to access this Crown copyright material and to download it onto electronic, magnetic, optical or similar storage media provided that such activities are for private research, study or in-house use only. Any other use of the material requires the formal written permission of Land Registry which can be requested from us, and is subject to an additional licence and associated charge.
Rightmove takes no liability for your use of, or reliance on, Rightmove's Instant Valuation due to the limitations of our tracking tool listed here. Use of this tool is taken entirely at your own risk. All rights reserved.