
House Prices in Llanddanielfab
House prices in Llanddanielfab have an overall average of £228,846 over the last year.
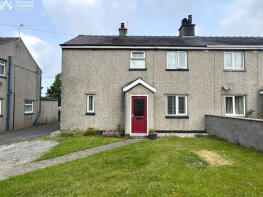
The majority of properties sold in Llanddanielfab during the last year were semi-detached properties, selling for an average price of £186,079. Detached properties sold for an average of £351,750, with terraced properties fetching £184,000.
Overall, the historical sold prices in Llanddanielfab over the last year were 9% up on the previous year and 1% down on the 2022 peak of £231,997.
Properties Sold
3, Ystad Ceris, Holyhead Road, Pentre Berw, Gaerwen LL60 6LF
| Today | See what it's worth now |
| 23 Apr 2026 | £185,000 |
| 31 Aug 2018 | £148,000 |
10, Tre Gof, Llanddaniel, Gaerwen LL60 6EU
| Today | See what it's worth now |
| 24 Mar 2026 | £260,000 |
No other historical records.
22, Tyn Rhos, Gaerwen LL60 6HL

| Today | See what it's worth now |
| 6 Mar 2026 | £170,000 |
| 16 Feb 2018 | £121,000 |
Morfa, Fair View Estate, Pentre Berw, Gaerwen LL60 6LE
| Today | See what it's worth now |
| 6 Mar 2026 | £283,000 |
No other historical records.
Coednant, Bangor Street, Holyhead Road, Gaerwen LL60 6BS

| Today | See what it's worth now |
| 4 Feb 2026 | £170,000 |
| 13 Feb 2023 | £152,000 |
92, Gaerwen Uchaf, Gaerwen LL60 6JW
| Today | See what it's worth now |
| 30 Jan 2026 | £182,500 |
| 19 Jun 2020 | £115,000 |
5, Plas Hen, Llanddaniel, Gaerwen LL60 6HW
| Today | See what it's worth now |
| 23 Jan 2026 | £220,000 |
| 14 Nov 2022 | £235,000 |
No other historical records.
38, Tyn Rhos, Gaerwen LL60 6HL
| Today | See what it's worth now |
| 22 Jan 2026 | £153,000 |
| 19 Jul 2007 | £113,500 |
80, Gaerwen Uchaf, Gaerwen LL60 6JW

| Today | See what it's worth now |
| 19 Jan 2026 | £185,000 |
| 14 Feb 2020 | £107,500 |
No other historical records.
3, Glanllyn, Holyhead Road, Gaerwen LL60 6BW
| Today | See what it's worth now |
| 18 Dec 2025 | £165,000 |
| 24 May 2023 | £165,000 |
67, Gaerwen Uchaf, Gaerwen LL60 6HN
| Today | See what it's worth now |
| 11 Dec 2025 | £150,000 |
| 22 Nov 2019 | £109,000 |
Gerlan, Holyhead Road, Gaerwen LL60 6AW
| Today | See what it's worth now |
| 5 Dec 2025 | £297,500 |
| 9 Apr 2021 | £210,000 |
No other historical records.
1, Bryngaer, Llanddaniel, Gaerwen LL60 6DT
| Today | See what it's worth now |
| 5 Dec 2025 | £180,000 |
No other historical records.
Gilfach Fach, Road From Llanddaniel Square To Junction Near Gwernllwyn, Llanddaniel, Gaerwen LL60 6ET

| Today | See what it's worth now |
| 19 Nov 2025 | £250,000 |
| 12 Dec 2016 | £131,000 |
87 Griolen, Gaerwen Uchaf, Gaerwen LL60 6JW
| Today | See what it's worth now |
| 14 Nov 2025 | £179,950 |
| 6 Apr 2023 | £171,000 |
20 Bwthyn Gwynion, Eurach Park, Ffordd Yr Ysgol, Llanddaniel, Gaerwen LL60 6EQ
| Today | See what it's worth now |
| 14 Nov 2025 | £305,000 |
| 15 Jul 2022 | £295,000 |
9, Berllan Estate, Llangaffo, Gaerwen LL60 6NJ
| Today | See what it's worth now |
| 30 Oct 2025 | £245,000 |
| 19 Feb 2016 | £140,000 |
4, Maes Gwyn, Llanddaniel, Gaerwen LL60 6EY
| Today | See what it's worth now |
| 28 Oct 2025 | £182,500 |
No other historical records.
11, Maes Y Coed, Llanddaniel, Gaerwen LL60 6DZ
| Today | See what it's worth now |
| 3 Oct 2025 | £215,000 |
| 9 Aug 2012 | £157,500 |
No other historical records.
32 Ty Ceirios, Gaerwen Uchaf, Gaerwen LL60 6HN
| Today | See what it's worth now |
| 29 Jul 2025 | £140,000 |
| 1 Feb 2000 | £36,000 |
Noddfa, Llanddaniel, Gaerwen LL60 6HB
| Today | See what it's worth now |
| 28 Jul 2025 | £755,000 |
No other historical records.
41, Tyn Rhos, Gaerwen LL60 6HL
| Today | See what it's worth now |
| 17 Jul 2025 | £165,000 |
| 4 Jul 2019 | £120,000 |
Penterfyn, Swn Yr Engan, Gaerwen LL60 6BL
| Today | See what it's worth now |
| 11 Jul 2025 | £225,000 |
No other historical records.
Source Acknowledgement: © Crown copyright. England and Wales house price data is publicly available information produced by the HM Land Registry.This material was last updated on 9 July 2026. It covers the period from 1 January 1995 to 30 April 2026 and contains property transactions which have been registered during that period. Contains HM Land Registry data © Crown copyright and database right 2026. This data is licensed under the Open Government Licence v3.0.
Disclaimer: Rightmove.co.uk provides this HM Land Registry data "as is". The burden for fitness of the data relies completely with the user and is provided for informational purposes only. No warranty, express or implied, is given relating to the accuracy of content of the HM Land Registry data and Rightmove does not accept any liability for error or omission. If you have found an error with the data or need further information please contact HM Land Registry.
Permitted Use: Viewers of this Information are granted permission to access this Crown copyright material and to download it onto electronic, magnetic, optical or similar storage media provided that such activities are for private research, study or in-house use only. Any other use of the material requires the formal written permission of Land Registry which can be requested from us, and is subject to an additional licence and associated charge.
Rightmove takes no liability for your use of, or reliance on, Rightmove's Instant Valuation due to the limitations of our tracking tool listed here. Use of this tool is taken entirely at your own risk. All rights reserved.