
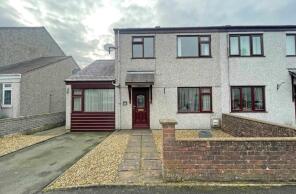
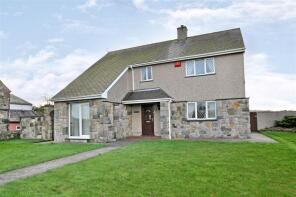
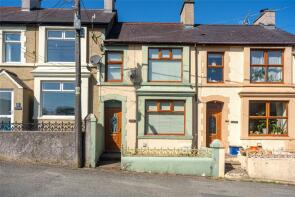
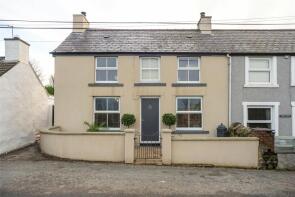
House Prices in Llanrug
House prices in Llanrug have an overall average of £217,606 over the last year.
The majority of properties sold in Llanrug during the last year were semi-detached properties, selling for an average price of £230,714. Detached properties sold for an average of £256,600, with terraced properties fetching £160,260.
Overall, the historical sold prices in Llanrug over the last year were 12% down on the previous year and 11% down on the 2022 peak of £244,393.
Properties Sold
54, Bro Rhythallt Estate, Caernarfon LL55 4AU

| Today | See what it's worth now |
| 9 Apr 2026 | £185,000 |
| 19 May 2020 | £112,500 |
No other historical records.
35, Bro Rhythallt Estate, Caernarfon LL55 4AU
| Today | See what it's worth now |
| 16 Mar 2026 | £195,000 |
| 15 Jul 2022 | £169,000 |
50 Llygad Yr Haul, Nant Y Glyn, Caernarfon LL55 4AH
| Today | See what it's worth now |
| 17 Feb 2026 | £235,000 |
| 17 Mar 2000 | £59,000 |
No other historical records.
24, Glanffynnon, Caernarfon LL55 4PR
| Today | See what it's worth now |
| 27 Jan 2026 | £205,000 |
| 1 Mar 1996 | £45,000 |
No other historical records.
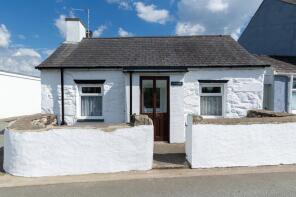
Y Bwthyn, Station Road, Caernarfon LL55 4BA
| Today | See what it's worth now |
| 28 Nov 2025 | £220,000 |
| 9 Mar 2007 | £140,000 |
2, Minffordd Terrace, Ffordd Minffordd, Llanrug LL55 4PU
| Today | See what it's worth now |
| 28 Nov 2025 | £145,000 |
No other historical records.
Islwyn, Ffordd Crawia, Llanrug LL55 4AE
| Today | See what it's worth now |
| 14 Nov 2025 | £125,000 |
No other historical records.
1, Cae Newydd, Ffordd Bryngwyn, Llanrug LL55 4AP
| Today | See what it's worth now |
| 31 Oct 2025 | £450,000 |
No other historical records.
Llys Llewelyn, Station Road, Caernarfon LL55 4AG

| Today | See what it's worth now |
| 24 Oct 2025 | £158,000 |
| 14 Apr 2015 | £133,500 |
7, Stryd Newydd To 1 Glyndwr Terrace, Caernarfon LL55 4DE
| Today | See what it's worth now |
| 13 Oct 2025 | £128,250 |
| 20 Dec 2018 | £94,000 |
Gwyrfai, Cefn Elan, Caernarfon LL55 4AE
| Today | See what it's worth now |
| 2 Oct 2025 | £170,000 |
| 27 Jan 2006 | £115,000 |
No other historical records.
40, Nant Y Glyn, Caernarfon LL55 4AH

| Today | See what it's worth now |
| 22 Aug 2025 | £298,000 |
| 6 May 2015 | £179,950 |
23, Nant Y Glyn, Caernarfon LL55 4AH
| Today | See what it's worth now |
| 14 Aug 2025 | £250,000 |
| 27 Jun 2013 | £160,500 |
Rhoswen, Llanrug LL55 4AN
| Today | See what it's worth now |
| 14 Aug 2025 | £405,000 |
| 10 May 2012 | £230,000 |
29, Glanffynnon, Llanrug LL55 4PR
| Today | See what it's worth now |
| 13 Aug 2025 | £190,000 |
No other historical records.
Isallt, Tai Rhythallt, Llanrug LL55 4AT
| Today | See what it's worth now |
| 7 Aug 2025 | £148,052 |
No other historical records.
Llys Arfon, Llanrug LL55 4AN
| Today | See what it's worth now |
| 1 Jul 2025 | £192,000 |
| 27 Nov 2020 | £163,000 |
No other historical records.
Rhyd Y Delyn, Ffordd Glan Moelyn, Caernarfon LL55 4PH
| Today | See what it's worth now |
| 23 Jun 2025 | £370,000 |
| 27 Mar 2015 | £215,000 |
Terfyn, Ceunant LL55 4RP

| Today | See what it's worth now |
| 20 Jun 2025 | £200,000 |
| 14 Dec 2021 | £180,000 |
8 Graig Fach, Nant Y Glyn, Caernarfon LL55 4AH
| Today | See what it's worth now |
| 27 May 2025 | £286,000 |
| 12 Jun 2009 | £175,000 |
Y Bonc, Bryn Bras, Llanrug LL55 4RG
| Today | See what it's worth now |
| 27 May 2025 | £285,000 |
| 1 Nov 2019 | £150,000 |
No other historical records.
6, Bryn Gwyn Terrace, Ceunant LL55 4RH
| Today | See what it's worth now |
| 25 May 2025 | £184,321 |
| 9 Sep 2011 | £110,000 |
No other historical records.
Eillionwy, Station Road, Caernarfon LL55 4BA

| Today | See what it's worth now |
| 14 May 2025 | £239,000 |
| 6 Jan 2017 | £100,000 |
Source Acknowledgement: © Crown copyright. England and Wales house price data is publicly available information produced by the HM Land Registry.This material was last updated on 9 July 2026. It covers the period from 1 January 1995 to 30 April 2026 and contains property transactions which have been registered during that period. Contains HM Land Registry data © Crown copyright and database right 2026. This data is licensed under the Open Government Licence v3.0.
Disclaimer: Rightmove.co.uk provides this HM Land Registry data "as is". The burden for fitness of the data relies completely with the user and is provided for informational purposes only. No warranty, express or implied, is given relating to the accuracy of content of the HM Land Registry data and Rightmove does not accept any liability for error or omission. If you have found an error with the data or need further information please contact HM Land Registry.
Permitted Use: Viewers of this Information are granted permission to access this Crown copyright material and to download it onto electronic, magnetic, optical or similar storage media provided that such activities are for private research, study or in-house use only. Any other use of the material requires the formal written permission of Land Registry which can be requested from us, and is subject to an additional licence and associated charge.
Rightmove takes no liability for your use of, or reliance on, Rightmove's Instant Valuation due to the limitations of our tracking tool listed here. Use of this tool is taken entirely at your own risk. All rights reserved.