
House Prices in Lower Blagdon
House prices in Lower Blagdon have an overall average of £217,577 over the last year.
The majority of properties sold in Lower Blagdon during the last year were semi-detached properties, selling for an average price of £232,912. Terraced properties sold for an average of £186,512, with detached properties fetching £334,024.
Overall, the historical sold prices in Lower Blagdon over the last year were 3% down on the previous year and 5% down on the 2023 peak of £230,137.
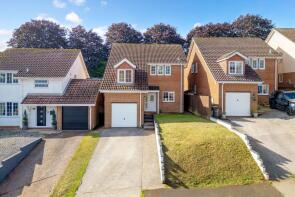
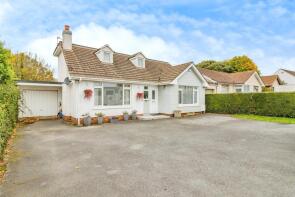
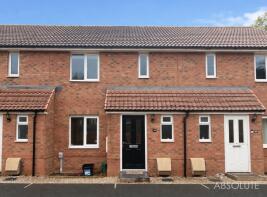
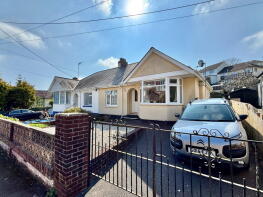
Properties Sold
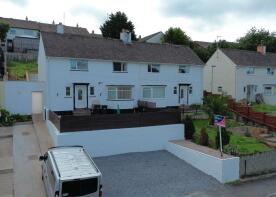
67, Smallcombe Road, Paignton TQ3 3TJ
| Today | See what it's worth now |
| 13 Apr 2026 | £280,000 |
| 28 Jun 2000 | £109,950 |
Annexe, 232, Kings Ash Road, Paignton TQ3 3XL
| Today | See what it's worth now |
| 10 Apr 2026 | £440,000 |
No other historical records.
44, Luscombe Close, Paignton TQ3 3GQ
| Today | See what it's worth now |
| 8 Apr 2026 | £235,000 |
| 21 Dec 2020 | £207,995 |
No other historical records.
55, Luscombe Close, Paignton TQ3 3GQ

| Today | See what it's worth now |
| 7 Apr 2026 | £230,000 |
| 27 Aug 2021 | £206,995 |
No other historical records.
29, Luscombe Road, Paignton TQ3 3TL
| Today | See what it's worth now |
| 30 Mar 2026 | £230,000 |
| 12 Aug 2010 | £145,000 |
7, Redwell Road, Paignton TQ3 3PY
| Today | See what it's worth now |
| 27 Mar 2026 | £277,500 |
| 29 Apr 2021 | £240,000 |
No other historical records.
4, Abelia Close, Paignton TQ3 3TQ
| Today | See what it's worth now |
| 27 Mar 2026 | £225,500 |
| 23 Jun 2000 | £77,000 |
78, Barton Avenue, Paignton TQ3 3HY
| Today | See what it's worth now |
| 25 Mar 2026 | £210,000 |
| 8 Jan 2021 | £205,000 |
40, Fernicombe Close, Paignton TQ3 3FG

| Today | See what it's worth now |
| 25 Mar 2026 | £225,000 |
No other historical records.
Flat 2, 15 Brent Court, Brent Road, Paignton TQ3 3AR
| Today | See what it's worth now |
| 20 Mar 2026 | £160,000 |
| 29 Oct 1999 | £137,000 |
84, Colley End Road, Paignton TQ3 3QY
| Today | See what it's worth now |
| 18 Mar 2026 | £251,300 |
| 6 May 2022 | £260,000 |
9, Winner Street, Paignton TQ3 3BN

| Today | See what it's worth now |
| 13 Mar 2026 | £130,000 |
| 29 Dec 1995 | £36,500 |
No other historical records.
7, Millbrook Road, Paignton TQ3 3AU
| Today | See what it's worth now |
| 6 Mar 2026 | £140,000 |
| 21 Sep 2007 | £142,000 |
6, Pleasant Terrace Rear, Paignton TQ3 3DA
| Today | See what it's worth now |
| 6 Mar 2026 | £170,000 |
| 28 Oct 2016 | £133,000 |
12, Luscombe Road, Paignton TQ3 3TN
| Today | See what it's worth now |
| 6 Mar 2026 | £180,000 |
| 17 Dec 2012 | £132,000 |
No other historical records.
1, Barnfield Road, Paignton TQ3 2JT
| Today | See what it's worth now |
| 3 Mar 2026 | £315,000 |
No other historical records.
108, Barton Avenue, Paignton TQ3 3HY
| Today | See what it's worth now |
| 27 Feb 2026 | £181,000 |
| 26 Oct 2005 | £145,000 |
5, Eden Grove, Paignton TQ3 2JL
| Today | See what it's worth now |
| 20 Feb 2026 | £180,000 |
| 30 Jul 2001 | £76,000 |
16, Barton Gardens, Paignton TQ3 3JB
| Today | See what it's worth now |
| 20 Feb 2026 | £225,000 |
| 24 Aug 2007 | £178,000 |
31, Whitebeam Close, Paignton TQ3 3GA
| Today | See what it's worth now |
| 17 Feb 2026 | £310,000 |
| 12 Sep 2002 | £208,000 |
124, Foxhole Road, Paignton TQ3 3ST
| Today | See what it's worth now |
| 16 Feb 2026 | £220,000 |
| 13 Aug 2020 | £160,000 |
No other historical records.
4, Waterleat Close, Paignton TQ3 3UN
| Today | See what it's worth now |
| 12 Feb 2026 | £265,000 |
| 31 Aug 2001 | £85,500 |
No other historical records.
123, Marldon Road, Paignton TQ3 3NN
| Today | See what it's worth now |
| 11 Feb 2026 | £352,000 |
No other historical records.
Source Acknowledgement: © Crown copyright. England and Wales house price data is publicly available information produced by the HM Land Registry.This material was last updated on 9 July 2026. It covers the period from 1 January 1995 to 30 April 2026 and contains property transactions which have been registered during that period. Contains HM Land Registry data © Crown copyright and database right 2026. This data is licensed under the Open Government Licence v3.0.
Disclaimer: Rightmove.co.uk provides this HM Land Registry data "as is". The burden for fitness of the data relies completely with the user and is provided for informational purposes only. No warranty, express or implied, is given relating to the accuracy of content of the HM Land Registry data and Rightmove does not accept any liability for error or omission. If you have found an error with the data or need further information please contact HM Land Registry.
Permitted Use: Viewers of this Information are granted permission to access this Crown copyright material and to download it onto electronic, magnetic, optical or similar storage media provided that such activities are for private research, study or in-house use only. Any other use of the material requires the formal written permission of Land Registry which can be requested from us, and is subject to an additional licence and associated charge.
Rightmove takes no liability for your use of, or reliance on, Rightmove's Instant Valuation due to the limitations of our tracking tool listed here. Use of this tool is taken entirely at your own risk. All rights reserved.