
House Prices in Lower Farringdon
House prices in Lower Farringdon have an overall average of £575,000 over the last year.
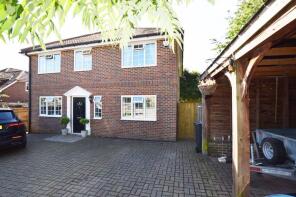
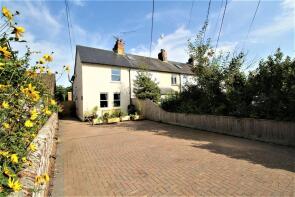
The majority of properties sold in Lower Farringdon during the last year were detached properties, selling for an average price of £750,000. Semi-detached properties sold for an average of £400,000.
Overall, the historical sold prices in Lower Farringdon over the last year were 30% up on the previous year and 10% down on the 2016 peak of £641,250.
Properties Sold
24, Shirnall Meadow, Lower Farringdon, Alton GU34 3DY
| Today | See what it's worth now |
| 9 Mar 2026 | £750,000 |
| 16 Nov 2012 | £474,950 |
Forge House, Gosport Road, Lower Farringdon, Alton GU34 3DL
| Today | See what it's worth now |
| 2 Oct 2025 | £400,000 |
| 19 Mar 2010 | £247,000 |
No other historical records.
Aylwards House, Gosport Road, Lower Farringdon, Alton GU34 3DL

| Today | See what it's worth now |
| 20 Nov 2024 | £575,000 |
| 30 Oct 2019 | £475,000 |
12, Shirnall Meadow, Lower Farringdon, Alton GU34 3DY
| Today | See what it's worth now |
| 4 Nov 2024 | £425,000 |
| 26 Feb 2020 | £307,000 |
No other historical records.
15, Shirnall Meadow, Lower Farringdon, Alton GU34 3DY

| Today | See what it's worth now |
| 5 Aug 2024 | £450,000 |
| 10 Feb 2023 | £445,000 |
5, Florrie Place, Gosport Road, Lower Farringdon, Alton GU34 3DL

| Today | See what it's worth now |
| 14 Jun 2024 | £315,000 |
No other historical records.
16, Shirnall Meadow, Lower Farringdon, Alton GU34 3DY
| Today | See what it's worth now |
| 14 Jun 2024 | £455,000 |
| 15 Feb 2019 | £355,000 |
The Platt, Brightstone Lane, Lower Farringdon, Alton GU34 3DP

| Today | See what it's worth now |
| 17 May 2024 | £492,000 |
No other historical records.
3, Lillian Place, Gosport Road, Lower Farringdon, Alton GU34 3DH
| Today | See what it's worth now |
| 17 Apr 2024 | £320,000 |
| 30 Aug 2019 | £257,500 |
1, Railway Cottages, Brightstone Lane, Lower Farringdon, Alton GU34 3DP

| Today | See what it's worth now |
| 22 Mar 2024 | £515,000 |
| 31 Jul 1997 | £56,000 |
No other historical records.
4, Lillian Place, Gosport Road, Lower Farringdon, Alton GU34 3DH

| Today | See what it's worth now |
| 15 Dec 2023 | £284,000 |
| 7 Nov 2017 | £255,000 |
Little Chimes, Shirnall Hill, Lower Farringdon, Alton GU34 3DR
| Today | See what it's worth now |
| 19 Apr 2023 | £450,000 |
No other historical records.
Old Post Office, Shirnall Hill, Lower Farringdon, Alton GU34 3DR

| Today | See what it's worth now |
| 12 Jan 2023 | £564,424 |
No other historical records.
8, Shirnall Meadow, Lower Farringdon, Alton GU34 3DY

| Today | See what it's worth now |
| 3 Oct 2022 | £428,000 |
| 30 Jun 2006 | £245,000 |
No other historical records.
The Chase, Gosport Road, Lower Farringdon, Alton GU34 3DL
| Today | See what it's worth now |
| 11 Mar 2022 | £667,000 |
| 26 Oct 2017 | £470,000 |
18, Shirnall Meadow, Lower Farringdon, Alton GU34 3DY

| Today | See what it's worth now |
| 25 Jun 2021 | £650,000 |
| 21 Dec 2007 | £480,000 |
Sparrows, Brightstone Lane, Lower Farringdon, Alton GU34 3DG

| Today | See what it's worth now |
| 5 May 2021 | £386,000 |
| 28 Nov 1997 | £60,000 |
No other historical records.
Copelands Cottage, Brightstone Lane, Lower Farringdon, Alton GU34 3DP
| Today | See what it's worth now |
| 13 Apr 2021 | £793,000 |
| 7 Feb 1997 | £210,000 |
No other historical records.
11, Shirnall Meadow, Lower Farringdon, Alton GU34 3DY

| Today | See what it's worth now |
| 19 Feb 2021 | £216,000 |
No other historical records.
3 Bay Trees, Aylwards Drive, Farringdon, Alton GU34 3DN
| Today | See what it's worth now |
| 12 Feb 2021 | £522,000 |
| 22 Jul 2005 | £99,875 |
No other historical records.
2, Kathleen Place, Gosport Road, Lower Farringdon, Alton GU34 3DJ
| Today | See what it's worth now |
| 20 Nov 2020 | £375,000 |
No other historical records.
Farringdon Hurst, Gosport Road, Lower Farringdon, Alton GU34 3DH

| Today | See what it's worth now |
| 30 Sep 2020 | £1,650,000 |
| 7 Aug 1998 | £550,000 |
No other historical records.
1, Shirnall Meadow, Lower Farringdon, Alton GU34 3DY

| Today | See what it's worth now |
| 28 Feb 2020 | £137,500 |
| 11 Sep 2015 | £135,000 |

Source Acknowledgement: © Crown copyright. England and Wales house price data is publicly available information produced by the HM Land Registry.This material was last updated on 9 July 2026. It covers the period from 1 January 1995 to 30 April 2026 and contains property transactions which have been registered during that period. Contains HM Land Registry data © Crown copyright and database right 2026. This data is licensed under the Open Government Licence v3.0.
Disclaimer: Rightmove.co.uk provides this HM Land Registry data "as is". The burden for fitness of the data relies completely with the user and is provided for informational purposes only. No warranty, express or implied, is given relating to the accuracy of content of the HM Land Registry data and Rightmove does not accept any liability for error or omission. If you have found an error with the data or need further information please contact HM Land Registry.
Permitted Use: Viewers of this Information are granted permission to access this Crown copyright material and to download it onto electronic, magnetic, optical or similar storage media provided that such activities are for private research, study or in-house use only. Any other use of the material requires the formal written permission of Land Registry which can be requested from us, and is subject to an additional licence and associated charge.
Rightmove takes no liability for your use of, or reliance on, Rightmove's Instant Valuation due to the limitations of our tracking tool listed here. Use of this tool is taken entirely at your own risk. All rights reserved.