
House Prices in Lower Kinsham
House prices in Lower Kinsham have an overall average of £345,635 over the last year.
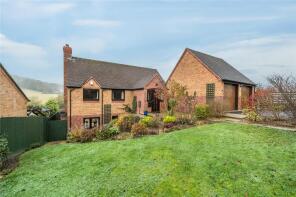
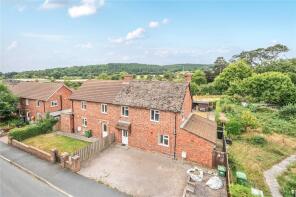
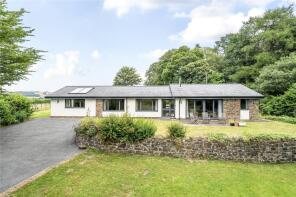
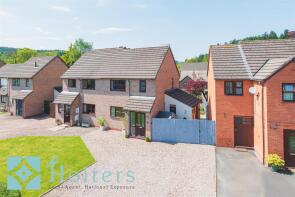
The majority of properties sold in Lower Kinsham during the last year were detached properties, selling for an average price of £389,875. Semi-detached properties sold for an average of £280,800, with terraced properties fetching £195,000.
Overall, the historical sold prices in Lower Kinsham over the last year were 15% up on the previous year and 8% up on the 2023 peak of £319,901.
Properties Sold
1, Church Close, Presteigne LD8 2AQ
| Today | See what it's worth now |
| 12 Mar 2026 | £275,000 |
| 22 Mar 2013 | £170,000 |
No other historical records.
23, Warden Close, Presteigne LD8 2DH
| Today | See what it's worth now |
| 20 Feb 2026 | £215,000 |
| 13 Jun 2022 | £280,000 |
No other historical records.
4, Offas Green, Norton, Presteigne LD8 2NX
| Today | See what it's worth now |
| 20 Feb 2026 | £435,000 |
| 2 Mar 2012 | £250,000 |
28, Warden Close, Presteigne LD8 2DH

| Today | See what it's worth now |
| 9 Jan 2026 | £240,000 |
| 4 Jun 2014 | £145,000 |
No other historical records.
12, Castle Road, Presteigne LD8 2EB
| Today | See what it's worth now |
| 11 Dec 2025 | £220,000 |
| 14 Oct 2020 | £170,000 |
Welsh Gate, Warden Road, Presteigne LD8 2NL
| Today | See what it's worth now |
| 20 Nov 2025 | £575,000 |
No other historical records.
19, Caenbrook Meadow, Presteigne LD8 2NE
| Today | See what it's worth now |
| 20 Nov 2025 | £235,000 |
| 3 Nov 2006 | £155,250 |
7 Talycoed, Orchard View, Evenjobb, Presteigne LD8 2SB
| Today | See what it's worth now |
| 24 Oct 2025 | £275,000 |
| 25 Sep 2017 | £205,000 |
11, Offas Green, Norton, Presteigne LD8 2NX
| Today | See what it's worth now |
| 22 Oct 2025 | £425,000 |
| 3 Jul 2015 | £260,000 |
10, Silia Meadow, Presteigne LD8 2NY

| Today | See what it's worth now |
| 21 Oct 2025 | £120,000 |
| 16 Jan 2015 | £280,000 |
Oxenbrook, B4355 From Junction With U1141 To Junction With U1342, Norton, Presteigne LD8 2EN
| Today | See what it's worth now |
| 30 Sep 2025 | £425,000 |
| 13 Aug 2009 | £140,000 |
No other historical records.
2 Fremlins, Clawdd Lane, New Radnor, Presteigne LD8 2TU
| Today | See what it's worth now |
| 30 Sep 2025 | £280,000 |
| 16 Nov 2015 | £174,000 |
Lower House Farm, Willey Lane, Lower Willey LD8 2LU
| Today | See what it's worth now |
| 26 Sep 2025 | £345,000 |
No other historical records.
Lower House, Combe Moor Lane, Presteigne LD8 2HY
| Today | See what it's worth now |
| 22 Sep 2025 | £406,700 |
| 15 Oct 2010 | £247,000 |
24, Warden Close, Presteigne LD8 2DH
| Today | See what it's worth now |
| 18 Sep 2025 | £185,000 |
| 19 Sep 1997 | £57,500 |
No other historical records.
18, Kings Court, Presteigne LD8 2AJ
| Today | See what it's worth now |
| 12 Sep 2025 | £228,000 |
| 3 Jun 2011 | £154,995 |
Little House, Water Street, New Radnor, Presteigne LD8 2SY
| Today | See what it's worth now |
| 1 Sep 2025 | £280,000 |
| 21 Feb 2024 | £270,000 |
8, Will's View, Norton, Presteigne LD8 2RS
| Today | See what it's worth now |
| 29 Aug 2025 | £312,500 |
| 12 Oct 2016 | £249,500 |
Garrison House, Church Street, Presteigne LD8 2BU
| Today | See what it's worth now |
| 29 Aug 2025 | £935,000 |
| 7 Oct 2011 | £540,000 |
No other historical records.
Stonewall Cottage, Stonewall Hill, Presteigne LD8 2HB
| Today | See what it's worth now |
| 28 Aug 2025 | £455,000 |
| 2 Aug 2016 | £331,000 |
Orchard Cottage, B4362 From Combe Corner To Wapley Lane, Presteigne LD8 2HY

| Today | See what it's worth now |
| 26 Aug 2025 | £740,000 |
| 7 Dec 2007 | £489,000 |
No other historical records.
Hanging Bank Cottage, Evenjobb, Presteigne LD8 2SG
| Today | See what it's worth now |
| 1 Aug 2025 | £500,000 |
No other historical records.
6, Milbank, Norton, Presteigne LD8 2EH
| Today | See what it's worth now |
| 30 Jul 2025 | £115,000 |
No other historical records.
Old School House, Scottleton Street, Presteigne LD8 2BL
| Today | See what it's worth now |
| 18 Jul 2025 | £385,000 |
| 19 Sep 2019 | £277,500 |
5, Clatterbrune, Presteigne LD8 2LB
| Today | See what it's worth now |
| 11 Jul 2025 | £265,000 |
| 26 Jun 2020 | £165,000 |
Source Acknowledgement: © Crown copyright. England and Wales house price data is publicly available information produced by the HM Land Registry.This material was last updated on 15 May 2026. It covers the period from 1 January 1995 to 31 March 2026 and contains property transactions which have been registered during that period. Contains HM Land Registry data © Crown copyright and database right 2026. This data is licensed under the Open Government Licence v3.0.
Disclaimer: Rightmove.co.uk provides this HM Land Registry data "as is". The burden for fitness of the data relies completely with the user and is provided for informational purposes only. No warranty, express or implied, is given relating to the accuracy of content of the HM Land Registry data and Rightmove does not accept any liability for error or omission. If you have found an error with the data or need further information please contact HM Land Registry.
Permitted Use: Viewers of this Information are granted permission to access this Crown copyright material and to download it onto electronic, magnetic, optical or similar storage media provided that such activities are for private research, study or in-house use only. Any other use of the material requires the formal written permission of Land Registry which can be requested from us, and is subject to an additional licence and associated charge.
Map data ©OpenStreetMap contributors.
Rightmove takes no liability for your use of, or reliance on, Rightmove's Instant Valuation due to the limitations of our tracking tool listed here. Use of this tool is taken entirely at your own risk. All rights reserved.