
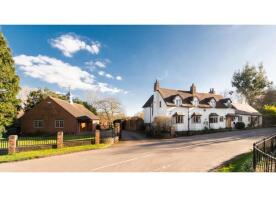
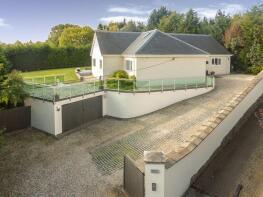
House Prices in Lowsonford
House prices in Lowsonford have an overall average of £720,000 over the last year.
The majority of properties sold in Lowsonford during the last year were detached properties, selling for an average price of £1,000,000. Terraced properties sold for an average of £440,000.
Overall, the historical sold prices in Lowsonford over the last year were 48% down on the previous year and 65% down on the 2023 peak of £2,076,903.
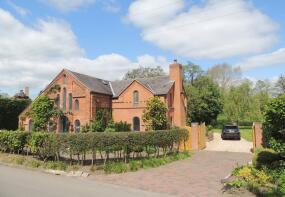
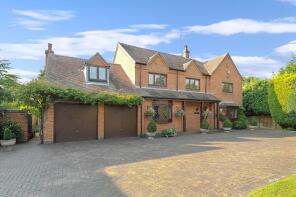
Properties Sold
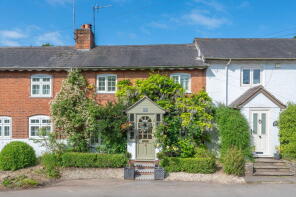
2 Rose Cottage, Lapworth Street, Bushwood, Henley-in-arden B95 5HG
| Today | See what it's worth now |
| 2 Oct 2025 | £440,000 |
| 8 Mar 2019 | £380,000 |
Cornerways, Rookery Lane, Henley-in-arden B95 5ER
| Today | See what it's worth now |
| 1 Aug 2025 | £1,000,000 |
| 4 Mar 2005 | £540,000 |
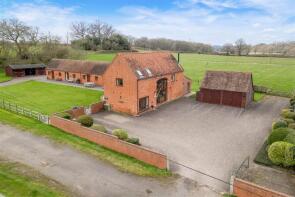
Lodge Farm Barn, Lapworth Street, Bushwood, Lowsonford B95 5ES
| Today | See what it's worth now |
| 29 Aug 2024 | £1,375,000 |
No other historical records.
Willowbrook House, Preston Fields Lane, Henley-in-arden B95 5EZ

| Today | See what it's worth now |
| 9 Jan 2024 | £1,400,000 |
| 29 Jun 2016 | £1,025,000 |
No other historical records.
Downlands, Mill Lane, Rowington, Henley-in-arden B95 5HH

| Today | See what it's worth now |
| 27 Oct 2023 | £3,800,000 |
| 16 Aug 2012 | £1,100,000 |
No other historical records.
Keepers Cottage, Bushwood Lane, Bushwood, Henley-in-arden B95 5EX

| Today | See what it's worth now |
| 9 Jun 2023 | £1,220,000 |
No other historical records.
Woodlands, Preston Road, Henley-in-arden B95 5EY

| Today | See what it's worth now |
| 1 Mar 2023 | £1,210,708 |
No other historical records.
Old Beams, Lapworth Street, Bushwood, Henley-in-arden B95 5HJ
| Today | See what it's worth now |
| 1 Jun 2022 | £1,500,000 |
No other historical records.
White Horse Cottage, Rookery Lane, Henley-in-arden B95 5ER
| Today | See what it's worth now |
| 1 Sep 2021 | £1,462,500 |
No other historical records.
Willowbrook Barn, Preston Fields Lane, Henley-in-arden B95 5EZ
| Today | See what it's worth now |
| 9 Apr 2021 | £770,000 |
| 17 Jul 2013 | £525,000 |
White House Barn, New Road, Lowsonford, Henley-in-arden B95 5HJ

| Today | See what it's worth now |
| 4 Dec 2020 | £1,195,000 |
No other historical records.
Rosary Cottage, Lapworth Street, Bushwood, Henley-in-arden B95 5HG

| Today | See what it's worth now |
| 15 Nov 2019 | £400,000 |
No other historical records.
Holly Bank, Lapworth Street, Bushwood, Henley-in-arden B95 5HG
| Today | See what it's worth now |
| 10 Sep 2019 | £735,000 |
| 15 Feb 2016 | £645,000 |
The Briars, Lapworth Street, Bushwood, Henley-in-arden B95 5HG
| Today | See what it's worth now |
| 26 Sep 2018 | £825,000 |
| 23 Jul 2009 | £460,000 |
Sintra House, Lapworth Street, Bushwood, Henley-in-arden B95 5HG
| Today | See what it's worth now |
| 17 Aug 2016 | £925,000 |
| 11 Dec 2009 | £680,000 |
No other historical records.
Bushwood House, Preston Road, Henley-in-arden B95 5EZ
| Today | See what it's worth now |
| 15 Feb 2016 | £825,000 |
No other historical records.
Chapel Haven, Narrow Lane, Henley-in-arden B95 5HN
| Today | See what it's worth now |
| 29 Jan 2016 | £925,000 |
| 25 Nov 2011 | £900,000 |
Alderbrook, Narrow Lane, Henley-in-arden B95 5HN
| Today | See what it's worth now |
| 30 Nov 2015 | £840,000 |
No other historical records.
10, Giffard Terrace, Lapworth Street, Bushwood, Henley-in-arden B95 5HQ

| Today | See what it's worth now |
| 20 Oct 2015 | £425,000 |
| 29 Jul 2011 | £356,000 |
Ashby Cottage, Lapworth Street, Bushwood, Henley-in-arden B95 5HJ
| Today | See what it's worth now |
| 9 Jun 2015 | £785,000 |
No other historical records.
Wychwood, Narrow Lane, Henley-in-arden B95 5HN

| Today | See what it's worth now |
| 9 Jan 2015 | £707,501 |
No other historical records.
Bushwood Barn, Bushwood Hall, Bushwood Lane, Bushwood, Henley-in-arden B95 5HA
| Today | See what it's worth now |
| 17 Dec 2014 | £745,000 |
No other historical records.
Denmar House, Preston Road, Lowsonford B95 5EY

| Today | See what it's worth now |
| 29 Aug 2014 | £790,000 |
| 3 Mar 1995 | £290,000 |
No other historical records.
Source Acknowledgement: © Crown copyright. England and Wales house price data is publicly available information produced by the HM Land Registry.This material was last updated on 9 July 2026. It covers the period from 1 January 1995 to 30 April 2026 and contains property transactions which have been registered during that period. Contains HM Land Registry data © Crown copyright and database right 2026. This data is licensed under the Open Government Licence v3.0.
Disclaimer: Rightmove.co.uk provides this HM Land Registry data "as is". The burden for fitness of the data relies completely with the user and is provided for informational purposes only. No warranty, express or implied, is given relating to the accuracy of content of the HM Land Registry data and Rightmove does not accept any liability for error or omission. If you have found an error with the data or need further information please contact HM Land Registry.
Permitted Use: Viewers of this Information are granted permission to access this Crown copyright material and to download it onto electronic, magnetic, optical or similar storage media provided that such activities are for private research, study or in-house use only. Any other use of the material requires the formal written permission of Land Registry which can be requested from us, and is subject to an additional licence and associated charge.
Rightmove takes no liability for your use of, or reliance on, Rightmove's Instant Valuation due to the limitations of our tracking tool listed here. Use of this tool is taken entirely at your own risk. All rights reserved.