
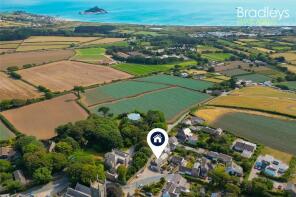
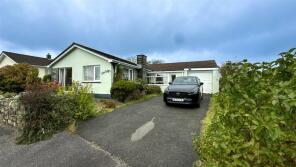
House Prices in Ludgvan
House prices in Ludgvan have an overall average of £392,750 over the last year.
The majority of properties sold in Ludgvan during the last year were detached properties, selling for an average price of £446,400. Terraced properties sold for an average of £317,500, with semi-detached properties fetching £275,000.
Overall, the historical sold prices in Ludgvan over the last year were 34% up on the previous year and 11% down on the 2022 peak of £440,725.
Properties Sold
Aymon, Eglos Road, Ludgvan TR20 8HG
| Today | See what it's worth now |
| 27 Feb 2026 | £275,000 |
No other historical records.
White Gables, Lower Quarter, Penzance TR20 8EG
| Today | See what it's worth now |
| 16 Jan 2026 | £362,000 |
No other historical records.
Hillcrest, Church Hill, Penzance TR20 8EU
| Today | See what it's worth now |
| 10 Oct 2025 | £410,000 |
| 13 Apr 2021 | £360,000 |
Cherry Tree Cottage, Church Hill, Penzance TR20 8EY
| Today | See what it's worth now |
| 12 Sep 2025 | £225,000 |
| 30 Oct 2020 | £200,000 |
Growethva, Cucurrian, Ludgvan TR20 8AP
| Today | See what it's worth now |
| 12 Aug 2025 | £700,000 |
No other historical records.
1, Shoot Row, Lower Quarter, Penzance TR20 8EJ
| Today | See what it's worth now |
| 18 Jul 2025 | £280,000 |
| 11 Jul 2002 | £130,000 |
No other historical records.
Chy-an-eglos, Eglos Road, Ludgvan TR20 8HQ
| Today | See what it's worth now |
| 17 Jul 2025 | £615,000 |
No other historical records.
Woodreeve, Church Hill, Ludgvan TR20 8EU
| Today | See what it's worth now |
| 11 Jul 2025 | £275,000 |
No other historical records.
7 Khanfield, Churchfield Close, Penzance TR20 8ER
| Today | See what it's worth now |
| 25 Jun 2025 | £315,000 |
| 19 Dec 2017 | £220,000 |
11 West Lodge, Bowglas Close, Penzance TR20 8HH
| Today | See what it's worth now |
| 4 Jun 2025 | £385,000 |
| 18 Jul 1997 | £42,500 |
No other historical records.
8, Churchfield Close, Penzance TR20 8ER
| Today | See what it's worth now |
| 7 Mar 2025 | £180,000 |
| 28 Oct 2011 | £150,000 |
Higher Carvossa Bungalow, Blowing House Hill, Ludgvan TR20 8AJ

| Today | See what it's worth now |
| 7 Mar 2025 | £239,000 |
No other historical records.
15, Fairfield, Ludgvan TR20 8ES

| Today | See what it's worth now |
| 7 Mar 2025 | £238,000 |
No other historical records.
Sunhaven, Ludgvan TR20 8HA
| Today | See what it's worth now |
| 19 Feb 2025 | £230,000 |
No other historical records.
4, Bowglas Close, Penzance TR20 8HH
| Today | See what it's worth now |
| 30 Jan 2025 | £360,000 |
| 15 Nov 2013 | £277,500 |
1, The Old Church School, Church Hill, Ludgvan TR20 8EU
| Today | See what it's worth now |
| 16 Aug 2024 | £325,000 |
| 29 Apr 1997 | £70,000 |
No other historical records.
2 The Mowhay, Trenowin Farm, Road From B3311 To Angwinack, Penzance TR20 8BL
| Today | See what it's worth now |
| 22 Jul 2024 | £375,000 |
No other historical records.
Perrans, Blowing House Hill, Ludgvan TR20 8AJ
| Today | See what it's worth now |
| 16 Jul 2024 | £285,000 |
| 16 Jul 2024 | £285,000 |
No other historical records.
Bystream, Lower Quarter, Ludgvan TR20 8EL

| Today | See what it's worth now |
| 29 May 2024 | £227,500 |
No other historical records.
Vinnik House, Lower Quarter, Penzance TR20 8EG
| Today | See what it's worth now |
| 25 Apr 2024 | £470,000 |
No other historical records.
Chy-kernyk, Road Between Angwinack And Lower Quarter, Vellanoweth, Penzance TR20 8BW

| Today | See what it's worth now |
| 21 Mar 2024 | £460,000 |
| 28 May 2021 | £425,000 |
Lower Trenowin Barn, Road From B3311 To Angwinack, Penzance TR20 8BL
| Today | See what it's worth now |
| 13 Mar 2024 | £900,000 |
| 3 Jun 2010 | £380,000 |
2, Carvossa Place, Ludgvan TR20 8AJ
| Today | See what it's worth now |
| 23 Feb 2024 | £105,000 |
No other historical records.


Source Acknowledgement: © Crown copyright. England and Wales house price data is publicly available information produced by the HM Land Registry.This material was last updated on 9 July 2026. It covers the period from 1 January 1995 to 30 April 2026 and contains property transactions which have been registered during that period. Contains HM Land Registry data © Crown copyright and database right 2026. This data is licensed under the Open Government Licence v3.0.
Disclaimer: Rightmove.co.uk provides this HM Land Registry data "as is". The burden for fitness of the data relies completely with the user and is provided for informational purposes only. No warranty, express or implied, is given relating to the accuracy of content of the HM Land Registry data and Rightmove does not accept any liability for error or omission. If you have found an error with the data or need further information please contact HM Land Registry.
Permitted Use: Viewers of this Information are granted permission to access this Crown copyright material and to download it onto electronic, magnetic, optical or similar storage media provided that such activities are for private research, study or in-house use only. Any other use of the material requires the formal written permission of Land Registry which can be requested from us, and is subject to an additional licence and associated charge.
Rightmove takes no liability for your use of, or reliance on, Rightmove's Instant Valuation due to the limitations of our tracking tool listed here. Use of this tool is taken entirely at your own risk. All rights reserved.