
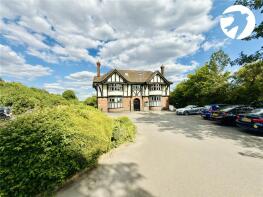
House Prices in Lullingstone
House prices in Lullingstone have an overall average of £592,389 over the last year.
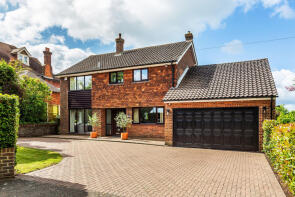
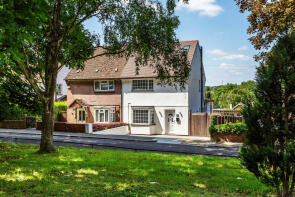
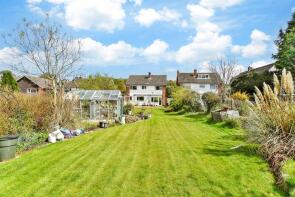
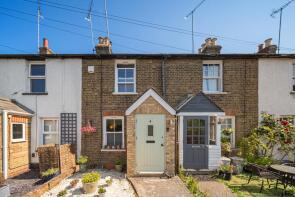
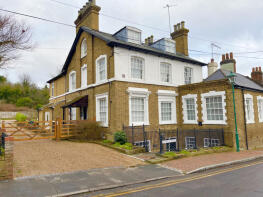
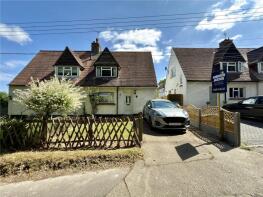
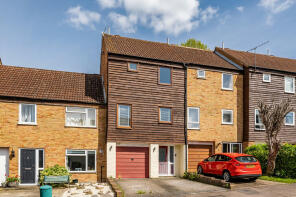
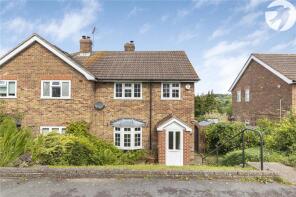
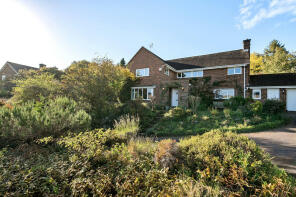
The majority of properties sold in Lullingstone during the last year were detached properties, selling for an average price of £870,000. Terraced properties sold for an average of £392,091, with semi-detached properties fetching £526,300.
Overall, the historical sold prices in Lullingstone over the last year were similar to the previous year and 10% down on the 2021 peak of £659,840.
Properties Sold
8, Malt Shovel Cottages, Station Road, Dartford DA4 0EP
| Today | See what it's worth now |
| 17 Apr 2026 | £393,000 |
| 10 Sep 2020 | £295,000 |
No other historical records.
3, Bank Cottages, High Street, Dartford DA4 0BA
| Today | See what it's worth now |
| 20 Mar 2026 | £398,000 |
| 16 Nov 2020 | £365,000 |
21, Eynsford Road, Dartford DA4 0BD

| Today | See what it's worth now |
| 19 Mar 2026 | £550,000 |
| 18 Aug 2017 | £580,000 |
Youens, Manor Farm, High Street, Dartford DA4 0DH

| Today | See what it's worth now |
| 26 Feb 2026 | £875,000 |
| 29 Aug 2012 | £695,000 |
5, Alton Cottages, High Street, Dartford DA4 0AX
| Today | See what it's worth now |
| 20 Feb 2026 | £385,000 |
| 6 Jul 2007 | £250,000 |
15, St Martins Drive, Eynsford DA4 0EY

| Today | See what it's worth now |
| 11 Feb 2026 | £1,045,000 |
No other historical records.
Burnside, Station Road, Dartford DA4 0EJ

| Today | See what it's worth now |
| 11 Feb 2026 | £685,000 |
| 23 May 2008 | £365,000 |
8, Horton Way, Dartford DA4 0DQ
| Today | See what it's worth now |
| 5 Feb 2026 | £975,000 |
| 22 Sep 2006 | £400,000 |
No other historical records.
11, 23 Lime Tree House, London Road, Dartford DA4 0JP
| Today | See what it's worth now |
| 30 Jan 2026 | £190,000 |
| 6 Aug 2018 | £68,000 |
Birling House, Station Road, Dartford DA4 0EJ
| Today | See what it's worth now |
| 5 Jan 2026 | £710,000 |
| 15 Feb 2010 | £465,000 |
Holly View House, Station Road, Dartford DA4 0ER
| Today | See what it's worth now |
| 17 Dec 2025 | £680,000 |
| 30 Sep 2022 | £745,000 |
20, Hillside, Dartford DA4 0DD

| Today | See what it's worth now |
| 4 Dec 2025 | £535,000 |
| 25 Mar 2002 | £280,000 |
Berisbon, White Post Hill, Dartford DA4 0LB
| Today | See what it's worth now |
| 27 Nov 2025 | £930,000 |
| 10 Feb 2017 | £745,000 |
16, Saddlers Park, Dartford DA4 0HA
| Today | See what it's worth now |
| 27 Nov 2025 | £585,000 |
| 1 Oct 2020 | £352,000 |
No other historical records.
38, Beesfield Lane, Farningham DA4 0BZ
| Today | See what it's worth now |
| 24 Nov 2025 | £730,000 |
No other historical records.
4, Malt Shovel Cottages, Station Road, Dartford DA4 0EP
| Today | See what it's worth now |
| 21 Nov 2025 | £365,000 |
| 20 Nov 2015 | £301,000 |
Flat 3, Sunnyside, London Road, Dartford DA4 0JP
| Today | See what it's worth now |
| 21 Nov 2025 | £250,000 |
| 10 Jan 2014 | £170,000 |
2, Bower Lane, Eynsford DA4 0HW
| Today | See what it's worth now |
| 14 Nov 2025 | £395,000 |
No other historical records.
38, Tilmans Mead, Dartford DA4 0BY
| Today | See what it's worth now |
| 7 Nov 2025 | £410,000 |
| 16 Nov 2020 | £392,000 |
44 Scotia, Beesfield Lane, Dartford DA4 0BZ

| Today | See what it's worth now |
| 7 Nov 2025 | £850,000 |
| 11 Nov 2022 | £782,000 |
No other historical records.
Wildacres Lodge, Farningham Hill Road, Dartford DA4 0JR
| Today | See what it's worth now |
| 6 Nov 2025 | £585,000 |
| 7 Mar 2014 | £1,652,000 |
No other historical records.
10, Gibsons Place, Dartford DA4 0AA

| Today | See what it's worth now |
| 3 Nov 2025 | £400,000 |
| 4 Dec 2009 | £275,000 |
No other historical records.
78, Pollyhaugh, Dartford DA4 0HF
| Today | See what it's worth now |
| 30 Sep 2025 | £490,000 |
| 29 Nov 2013 | £350,000 |
Source Acknowledgement: © Crown copyright. England and Wales house price data is publicly available information produced by the HM Land Registry.This material was last updated on 9 July 2026. It covers the period from 1 January 1995 to 30 April 2026 and contains property transactions which have been registered during that period. Contains HM Land Registry data © Crown copyright and database right 2026. This data is licensed under the Open Government Licence v3.0.
Disclaimer: Rightmove.co.uk provides this HM Land Registry data "as is". The burden for fitness of the data relies completely with the user and is provided for informational purposes only. No warranty, express or implied, is given relating to the accuracy of content of the HM Land Registry data and Rightmove does not accept any liability for error or omission. If you have found an error with the data or need further information please contact HM Land Registry.
Permitted Use: Viewers of this Information are granted permission to access this Crown copyright material and to download it onto electronic, magnetic, optical or similar storage media provided that such activities are for private research, study or in-house use only. Any other use of the material requires the formal written permission of Land Registry which can be requested from us, and is subject to an additional licence and associated charge.
Rightmove takes no liability for your use of, or reliance on, Rightmove's Instant Valuation due to the limitations of our tracking tool listed here. Use of this tool is taken entirely at your own risk. All rights reserved.