
House Prices in Mannerston
House prices in Mannerston have an overall average of £295,612 over the last year.
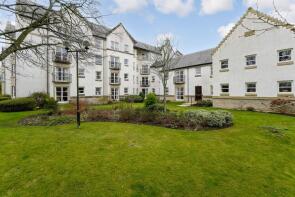
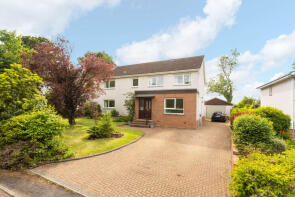
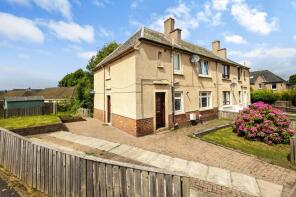
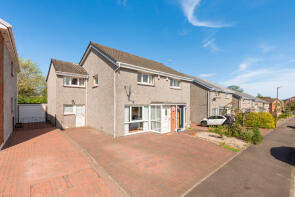
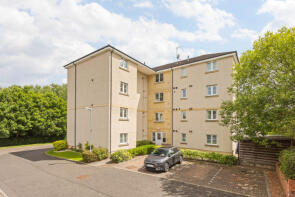
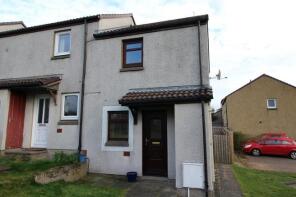
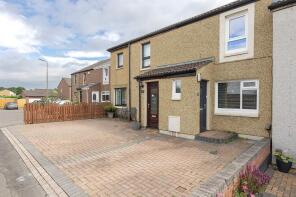
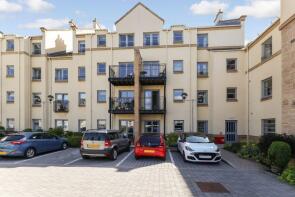
The majority of properties sold in Mannerston during the last year were flats, selling for an average price of £190,504. Detached properties sold for an average of £510,825, with terraced properties fetching £227,945.
Overall, the historical sold prices in Mannerston over the last year were 6% up on the previous year and 8% down on the 2021 peak of £321,015.
Properties Sold
5, Kinloch View, Blackness Road, Linlithgow EH49 7HT
| Today | See what it's worth now |
| 31 Oct 2025 | £185,000 |
| 5 Aug 2021 | £150,000 |
No other historical records.
3, Longcroft Gardens, Linlithgow EH49 7RR
| Today | See what it's worth now |
| 8 Oct 2025 | £775,000 |
| 5 Aug 2015 | £585,000 |
No other historical records.
10, Millerfield, Linlithgow Bridge, Linlithgow EH49 7RE
| Today | See what it's worth now |
| 7 Oct 2025 | £145,000 |
| 31 Mar 2005 | £75,000 |
No other historical records.
63, Belsyde Court, Linlithgow Bridge, Linlithgow EH49 7RL

| Today | See what it's worth now |
| 2 Oct 2025 | £138,500 |
| 8 Sep 2006 | £83,000 |
No other historical records.
30, Dovecot Park, Linlithgow EH49 7LH
| Today | See what it's worth now |
| 23 Sep 2025 | £317,000 |
| 14 Nov 2003 | £127,195 |
No other historical records.
37, Broomyhill Place, Linlithgow Bridge, Linlithgow EH49 7BZ
| Today | See what it's worth now |
| 23 Sep 2025 | £155,000 |
| 17 Apr 2023 | £143,000 |
33, Kingsfield, Linlithgow EH49 7SJ
| Today | See what it's worth now |
| 22 Sep 2025 | £185,000 |
| 20 May 2019 | £120,328 |
No other historical records.
71, Burghmuir Court, Linlithgow EH49 7LL
| Today | See what it's worth now |
| 19 Sep 2025 | £192,500 |
| 21 Dec 2020 | £167,500 |
103, Springfield Road, Linlithgow EH49 7JP

| Today | See what it's worth now |
| 19 Sep 2025 | £340,000 |
No other historical records.
32, Templars Court, High Street, Linlithgow EH49 7EA
| Today | See what it's worth now |
| 19 Sep 2025 | £215,000 |
| 25 Sep 2015 | £184,450 |
No other historical records.
39, Philip Avenue, Linlithgow EH49 7BH

| Today | See what it's worth now |
| 19 Sep 2025 | £460,000 |
| 17 Oct 2019 | £340,000 |
52, Kingsfield, Linlithgow EH49 7SL
| Today | See what it's worth now |
| 18 Sep 2025 | £163,500 |
| 6 Dec 2018 | £115,500 |
30, Clark Avenue, Linlithgow EH49 7AP
| Today | See what it's worth now |
| 16 Sep 2025 | £650,000 |
| 7 Nov 2013 | £455,000 |
No other historical records.
16, Mannerston Holdings, Blackness EH49 7ND


| Today | See what it's worth now |
| 16 Sep 2025 | £598,000 |
No other historical records.
6, Bells Burn Avenue, Linlithgow EH49 7LB
| Today | See what it's worth now |
| 15 Sep 2025 | £262,500 |
| 4 Jun 2008 | £142,000 |
No other historical records.
11, Longcroft Gardens, Linlithgow EH49 7RR

| Today | See what it's worth now |
| 12 Sep 2025 | £585,000 |
No other historical records.
8, Springfield Grange, Linlithgow EH49 7HA
| Today | See what it's worth now |
| 11 Sep 2025 | £715,000 |
| 22 Dec 2015 | £521,567 |
88, Kingsfield, Linlithgow EH49 7SL

| Today | See what it's worth now |
| 10 Sep 2025 | £112,500 |
| 1 Nov 2007 | £95,000 |
20b, High Street, Linlithgow EH49 7AE
| Today | See what it's worth now |
| 9 Sep 2025 | £265,000 |
| 24 Nov 2017 | £168,000 |
East Boghall Cottage, A803 - U1 To Springfield Road, Linlithgow EH49 7GR
| Today | See what it's worth now |
| 8 Sep 2025 | £374,125 |
| 24 Aug 2022 | £365,000 |
35, Dovecot Park, Linlithgow EH49 7LH
| Today | See what it's worth now |
| 8 Sep 2025 | £325,000 |
| 13 Jun 2005 | £149,550 |
No other historical records.
173, Bailielands, Linlithgow EH49 7SZ
| Today | See what it's worth now |
| 5 Sep 2025 | £275,000 |
| 8 Aug 2019 | £226,000 |
71, Bailielands, Linlithgow EH49 7SX
| Today | See what it's worth now |
| 5 Sep 2025 | £330,000 |
| 24 Jun 2014 | £230,000 |
36, Sheriffs Park, Linlithgow EH49 7SS
| Today | See what it's worth now |
| 2 Sep 2025 | £470,000 |
| 30 Mar 2022 | £450,000 |
43, Kingsfield, Linlithgow EH49 7SJ
| Today | See what it's worth now |
| 2 Sep 2025 | £187,000 |
| 24 Dec 2020 | £163,000 |
Source Acknowledgement: © Crown copyright. Scottish house price data is publicly available information produced by the Registers of Scotland. Material has been reproduced with the permission of the Keeper of the Registers of Scotland and contains data compiled by Registers of Scotland. For further information, please contact data@ros.gov.uk. Please note the dates shown here relate to the property's registered date not sold date.This material was last updated on 2 December 2025. It covers the period from 8 December 1987 to 31 October 2025 and contains property transactions which have been registered during that period.
Disclaimer: Rightmove.co.uk provides this Registers of Scotland data "as is". The burden for fitness of the data relies completely with the user and is provided for informational purposes only. No warranty, express or implied, is given relating to the accuracy of content of the Registers of Scotland data and Rightmove plc does not accept any liability for error or omission. If you have found an error with the data or need further information please contact data@ros.gov.uk
Permitted Use: The Registers of Scotland allows the reproduction of the data which it provides to Rightmove.co.uk free of charge in any format or medium only for research, private study or for internal circulation within an organisation. This is subject to it being reproduced accurately and not used in a misleading context. The material must be acknowledged as Crown Copyright. You are not allowed to use this information for commercial purposes, nor must you copy, distribute, sell or publish the data in any way. For any other use of this material, please apply to the Registers of Scotland for a licence. You can do this online at www.ros.gov.uk, by email at data@ros.gov.uk or by writing to Business Development, Registers of Scotland, Meadowbank House, 153 London Road, Edinburgh EH8 7AU.
Map data ©OpenStreetMap contributors.
Rightmove takes no liability for your use of, or reliance on, Rightmove's Instant Valuation due to the limitations of our tracking tool listed here. Use of this tool is taken entirely at your own risk. All rights reserved.