
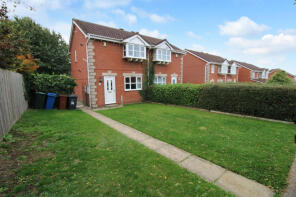
House Prices in Mapplewell
House prices in Mapplewell have an overall average of £219,095 over the last year.
The majority of properties sold in Mapplewell during the last year were detached properties, selling for an average price of £327,806. Terraced properties sold for an average of £152,858, with semi-detached properties fetching £195,081.
Overall, the historical sold prices in Mapplewell over the last year were 6% up on the previous year and 6% up on the 2023 peak of £207,572.
Properties Sold
10, Eshton Court, Staincross, Barnsley S75 5QG
| Today | See what it's worth now |
| 17 Apr 2026 | £72,000 |
| 31 Mar 2017 | £85,000 |
No other historical records.
11, Malincroft, Mapplewell, Barnsley S75 6GB
| Today | See what it's worth now |
| 17 Apr 2026 | £440,000 |
| 3 Aug 2012 | £167,000 |
7, Hamble Court, Mapplewell, Barnsley S75 6FE
| Today | See what it's worth now |
| 2 Apr 2026 | £215,000 |
| 13 Oct 2017 | £132,000 |
3, Wells Court, Mapplewell, Barnsley S75 6BF
| Today | See what it's worth now |
| 30 Mar 2026 | £110,000 |
| 31 Jan 2003 | £57,950 |
274, New Road, Staincross, Barnsley S75 6GP
| Today | See what it's worth now |
| 27 Mar 2026 | £155,000 |
| 2 Dec 2024 | £137,000 |
18, Longsight Road, Staincross, Barnsley S75 6HB
| Today | See what it's worth now |
| 27 Mar 2026 | £190,000 |
| 30 Aug 2019 | £128,000 |
197, Spark Lane, Mapplewell, Barnsley S75 6AF
| Today | See what it's worth now |
| 23 Mar 2026 | £340,000 |
| 30 Jun 2014 | £170,000 |
24, Brattice Way, Mapplewell, Barnsley S75 6GX
| Today | See what it's worth now |
| 18 Mar 2026 | £210,000 |
| 8 Feb 2021 | £155,000 |
357, New Road, Staincross, Barnsley S75 6ES
| Today | See what it's worth now |
| 13 Mar 2026 | £240,000 |
| 18 Feb 2021 | £205,000 |
38, New Street, Staincross, Barnsley S75 6EJ
| Today | See what it's worth now |
| 9 Mar 2026 | £120,000 |
| 24 Sep 2024 | £110,000 |
143, Greenside, Staincross, Barnsley S75 6AY
| Today | See what it's worth now |
| 6 Mar 2026 | £107,000 |
| 19 May 2009 | £90,000 |
14, Beaulieu Close, Mapplewell, Barnsley S75 6FJ
| Today | See what it's worth now |
| 26 Feb 2026 | £175,000 |
| 21 Jun 2006 | £113,000 |
29, Bentham Way, Staincross, Barnsley S75 5QA
| Today | See what it's worth now |
| 25 Feb 2026 | £175,000 |
| 5 Jul 2019 | £115,000 |
27, Priest Royd, Darton, Barnsley S75 5AJ

| Today | See what it's worth now |
| 17 Feb 2026 | £285,000 |
| 12 Sep 2003 | £128,000 |
144, New Road, Staincross, Barnsley S75 6PP
| Today | See what it's worth now |
| 17 Feb 2026 | £140,000 |
| 29 Jun 2007 | £75,000 |
No other historical records.
87, Pye Avenue, Mapplewell, Barnsley S75 6AG
| Today | See what it's worth now |
| 13 Feb 2026 | £116,000 |
| 1 Jul 2016 | £60,000 |
No other historical records.
108, Kingsway, Staincross, Barnsley S75 6EU
| Today | See what it's worth now |
| 6 Feb 2026 | £250,000 |
No other historical records.
82, Spark Lane, Mapplewell, Barnsley S75 6AD
| Today | See what it's worth now |
| 28 Jan 2026 | £155,000 |
| 14 Jun 2019 | £78,000 |
2, Brattice Way, Mapplewell, Barnsley S75 6GX
| Today | See what it's worth now |
| 23 Jan 2026 | £323,000 |
| 25 Aug 2017 | £249,950 |
No other historical records.
385, Darton Lane, Mapplewell, Barnsley S75 6AL
| Today | See what it's worth now |
| 7 Jan 2026 | £347,500 |
| 14 Jan 2002 | £50,000 |
No other historical records.
97, Pye Avenue, Mapplewell, Barnsley S75 6AG
| Today | See what it's worth now |
| 18 Dec 2025 | £125,000 |
| 18 Aug 2023 | £61,000 |
No other historical records.
198, New Road, Staincross, Barnsley S75 6PP
| Today | See what it's worth now |
| 5 Dec 2025 | £285,000 |
| 11 Dec 2012 | £124,995 |
No other historical records.
361, Darton Lane, Mapplewell, Barnsley S75 6AW
| Today | See what it's worth now |
| 28 Nov 2025 | £152,500 |
| 3 Mar 2016 | £96,000 |
Source Acknowledgement: © Crown copyright. England and Wales house price data is publicly available information produced by the HM Land Registry.This material was last updated on 9 July 2026. It covers the period from 1 January 1995 to 30 April 2026 and contains property transactions which have been registered during that period. Contains HM Land Registry data © Crown copyright and database right 2026. This data is licensed under the Open Government Licence v3.0.
Disclaimer: Rightmove.co.uk provides this HM Land Registry data "as is". The burden for fitness of the data relies completely with the user and is provided for informational purposes only. No warranty, express or implied, is given relating to the accuracy of content of the HM Land Registry data and Rightmove does not accept any liability for error or omission. If you have found an error with the data or need further information please contact HM Land Registry.
Permitted Use: Viewers of this Information are granted permission to access this Crown copyright material and to download it onto electronic, magnetic, optical or similar storage media provided that such activities are for private research, study or in-house use only. Any other use of the material requires the formal written permission of Land Registry which can be requested from us, and is subject to an additional licence and associated charge.
Rightmove takes no liability for your use of, or reliance on, Rightmove's Instant Valuation due to the limitations of our tracking tool listed here. Use of this tool is taken entirely at your own risk. All rights reserved.