
House Prices in Mark Causeway
House prices in Mark Causeway have an overall average of £415,431 over the last year.
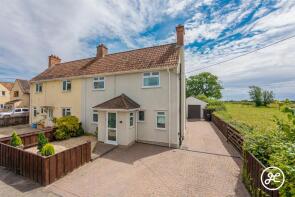
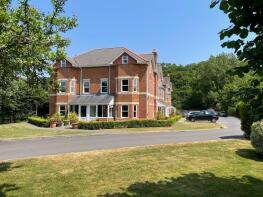
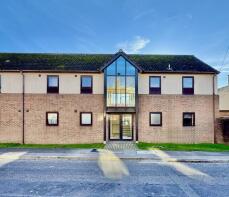
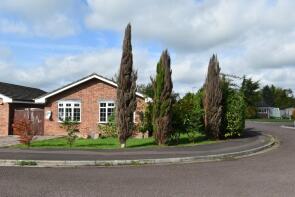
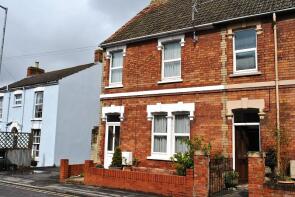
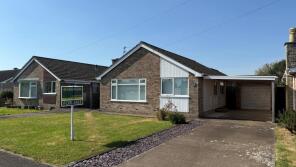
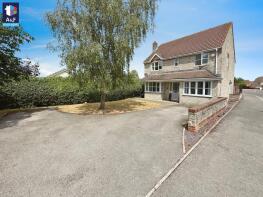
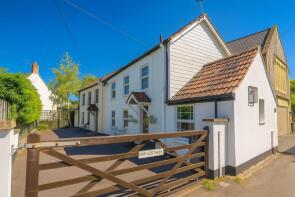
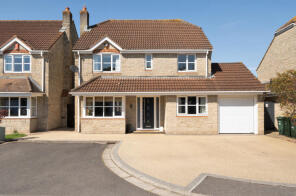
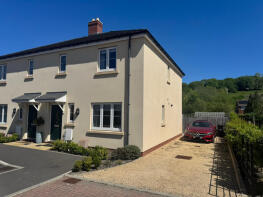
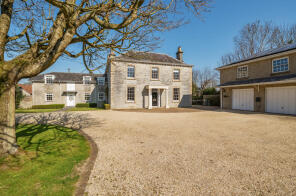
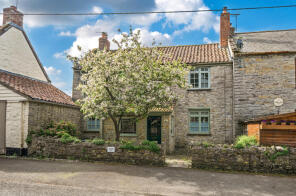
The majority of properties sold in Mark Causeway during the last year were detached properties, selling for an average price of £529,524. Semi-detached properties sold for an average of £351,250, with terraced properties fetching £259,833.
Overall, the historical sold prices in Mark Causeway over the last year were 6% up on the previous year and 9% down on the 2023 peak of £455,812.
Properties Sold
Southover, Station Road, Brent Knoll, Highbridge TA9 4BH
| Today | See what it's worth now |
| 15 Apr 2026 | £487,500 |
| 3 Jul 1998 | £117,500 |
No other historical records.
Rosedene, The Wall, Mark, Highbridge TA9 4LX
| Today | See what it's worth now |
| 27 Mar 2026 | £182,500 |
| 14 May 2021 | £170,000 |
Linway, Mark Road, Watchfield, Highbridge TA9 4RD

| Today | See what it's worth now |
| 19 Mar 2026 | £240,000 |
| 8 Apr 1998 | £70,000 |
Yeolands, Brent Road, East Brent, Highbridge TA9 4JD

| Today | See what it's worth now |
| 5 Mar 2026 | £507,000 |
| 28 Nov 2003 | £227,000 |
Over The Way, The Causeway, Mark, Highbridge TA9 4QH
| Today | See what it's worth now |
| 3 Mar 2026 | £640,000 |
| 11 Jul 2002 | £345,000 |
9, Johnson Close, East Brent, Highbridge TA9 4RZ
| Today | See what it's worth now |
| 16 Feb 2026 | £399,950 |
No other historical records.
6, Council Houses, The Causeway, Mark, Highbridge TA9 4QG
| Today | See what it's worth now |
| 13 Feb 2026 | £432,500 |
| 31 Aug 2001 | £110,000 |
No other historical records.
1, 132, Brent Street, Brent Knoll, Highbridge TA9 4BB
| Today | See what it's worth now |
| 13 Feb 2026 | £285,000 |
| 14 Feb 2019 | £258,500 |
3, 24 Orchard Court, Walrow Road, Highbridge TA9 4AD
| Today | See what it's worth now |
| 30 Jan 2026 | £91,000 |
| 15 Feb 2017 | £69,500 |
5, Queensway Close, Mark, Highbridge TA9 4PH
| Today | See what it's worth now |
| 16 Jan 2026 | £285,000 |
| 21 Sep 2007 | £190,000 |
No other historical records.
4, Walrow Road, Highbridge TA9 4AB
| Today | See what it's worth now |
| 13 Jan 2026 | £250,000 |
| 3 Sep 2014 | £160,500 |
30, Merryfield, Mark, Highbridge TA9 4NB
| Today | See what it's worth now |
| 9 Jan 2026 | £335,000 |
| 22 May 2015 | £220,000 |
No other historical records.
1, Red House Road, East Brent, Highbridge TA9 4RX
| Today | See what it's worth now |
| 9 Jan 2026 | £430,000 |
| 16 Jun 1995 | £112,950 |
No other historical records.
1, Ivy Cottage, Brent Road, East Brent, Highbridge TA9 4JD
| Today | See what it's worth now |
| 12 Dec 2025 | £215,000 |
| 2 Dec 2009 | £134,500 |
3, Popham Close, East Brent, Highbridge TA9 4RY
| Today | See what it's worth now |
| 12 Dec 2025 | £455,000 |
| 19 Sep 2005 | £295,000 |
2, Bakers Field, Brent Knoll, Highbridge TA9 4DP
| Today | See what it's worth now |
| 28 Nov 2025 | £305,000 |
| 12 Nov 2021 | £310,000 |
No other historical records.
Knoll Brook, Brent Road, East Brent, Highbridge TA9 4JD

| Today | See what it's worth now |
| 26 Nov 2025 | £515,000 |
| 2 Feb 2006 | £218,000 |
No other historical records.
The Old Vicarage, Vicarage Lane, Mark, Highbridge TA9 4NN
| Today | See what it's worth now |
| 20 Nov 2025 | £1,275,000 |
| 9 Jul 2015 | £950,000 |
Wiven Cottage, Little Moor Road, Mark, Highbridge TA9 4NG
| Today | See what it's worth now |
| 13 Nov 2025 | £475,000 |
No other historical records.
6, Coombe Side, Brent Knoll, Highbridge TA9 4ED

| Today | See what it's worth now |
| 4 Nov 2025 | £370,000 |
| 27 Oct 2020 | £327,500 |
33, Walrow Road, Highbridge TA9 4AB
| Today | See what it's worth now |
| 3 Oct 2025 | £220,000 |
| 11 May 2016 | £147,000 |
Kimberly, The Causeway, Mark, Highbridge TA9 4QT
| Today | See what it's worth now |
| 26 Sep 2025 | £460,000 |
| 18 Sep 2015 | £322,500 |
26, Somerset Way, Highbridge TA9 4AT
| Today | See what it's worth now |
| 26 Sep 2025 | £140,000 |
| 28 Jan 2005 | £117,000 |
No other historical records.
Source Acknowledgement: © Crown copyright. England and Wales house price data is publicly available information produced by the HM Land Registry.This material was last updated on 9 July 2026. It covers the period from 1 January 1995 to 30 April 2026 and contains property transactions which have been registered during that period. Contains HM Land Registry data © Crown copyright and database right 2026. This data is licensed under the Open Government Licence v3.0.
Disclaimer: Rightmove.co.uk provides this HM Land Registry data "as is". The burden for fitness of the data relies completely with the user and is provided for informational purposes only. No warranty, express or implied, is given relating to the accuracy of content of the HM Land Registry data and Rightmove does not accept any liability for error or omission. If you have found an error with the data or need further information please contact HM Land Registry.
Permitted Use: Viewers of this Information are granted permission to access this Crown copyright material and to download it onto electronic, magnetic, optical or similar storage media provided that such activities are for private research, study or in-house use only. Any other use of the material requires the formal written permission of Land Registry which can be requested from us, and is subject to an additional licence and associated charge.
Rightmove takes no liability for your use of, or reliance on, Rightmove's Instant Valuation due to the limitations of our tracking tool listed here. Use of this tool is taken entirely at your own risk. All rights reserved.