
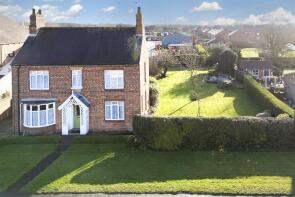
House Prices in Market Weighton
House prices in Market Weighton have an overall average of £247,549 over the last year.
The majority of properties sold in Market Weighton during the last year were detached properties, selling for an average price of £314,258. Semi-detached properties sold for an average of £214,629, with terraced properties fetching £187,744.
Overall, the historical sold prices in Market Weighton over the last year were 3% up on the previous year and 3% down on the 2023 peak of £254,770.
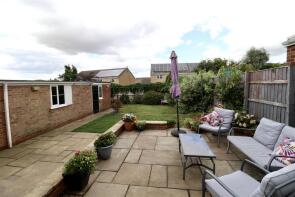
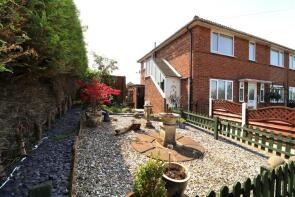
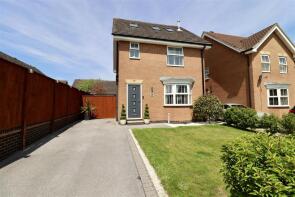
Properties Sold
9, Farm Court, York YO43 3NS
| Today | See what it's worth now |
| 10 Apr 2026 | £320,000 |
| 12 Dec 2019 | £215,000 |
3, Wold Avenue, York YO43 3DQ
| Today | See what it's worth now |
| 1 Apr 2026 | £176,500 |
| 2 Jul 2002 | £80,000 |
No other historical records.
24 Rosedene, Sandwalk, York YO43 3HQ
| Today | See what it's worth now |
| 1 Apr 2026 | £399,950 |
| 13 Aug 2021 | £240,000 |
No other historical records.
8, Burlington Place, Market Weighton YO43 3SA
| Today | See what it's worth now |
| 27 Mar 2026 | £260,000 |
| 24 Jul 2025 | £258,000 |
19, Beales Close, York YO43 3RU
| Today | See what it's worth now |
| 27 Mar 2026 | £258,000 |
| 14 Aug 2020 | £214,995 |
No other historical records.
22, Westfield Crescent, York YO43 3EL

| Today | See what it's worth now |
| 27 Mar 2026 | £150,000 |
| 21 Dec 2022 | £147,000 |
7, Holme Road, York YO43 3EQ
| Today | See what it's worth now |
| 19 Mar 2026 | £262,000 |
| 6 Jul 2022 | £250,000 |
17, Bow Bridge Close, York YO43 3FH
| Today | See what it's worth now |
| 19 Mar 2026 | £305,000 |
| 17 Nov 2014 | £205,000 |
9, Cooper Street, York YO43 3FR
| Today | See what it's worth now |
| 9 Mar 2026 | £285,000 |
| 30 Jun 2021 | £245,000 |
Roxby House, Holme Road, Market Weighton YO43 3EW
| Today | See what it's worth now |
| 4 Mar 2026 | £325,000 |
No other historical records.
6, Sancton Road, York YO43 3DB
| Today | See what it's worth now |
| 27 Feb 2026 | £167,000 |
| 4 Dec 2020 | £145,000 |
1, Harold Elgey Close, York YO43 3FJ
| Today | See what it's worth now |
| 27 Feb 2026 | £196,000 |
| 17 Sep 2013 | £135,000 |
No other historical records.
9, Sandholme, York YO43 3ND
| Today | See what it's worth now |
| 26 Feb 2026 | £200,000 |
| 23 Sep 2011 | £120,000 |
22, Wicstun Way, York YO43 3NL
| Today | See what it's worth now |
| 24 Feb 2026 | £125,000 |
| 25 Jul 2002 | £59,700 |
No other historical records.
8, Sandholme, York YO43 3ND
| Today | See what it's worth now |
| 20 Feb 2026 | £225,000 |
| 18 Jul 2024 | £193,000 |
41, Ash Grove, York YO43 3DY
| Today | See what it's worth now |
| 20 Feb 2026 | £212,500 |
| 14 Nov 2022 | £185,000 |
24, Northgate Vale, York YO43 3EA
| Today | See what it's worth now |
| 16 Feb 2026 | £215,000 |
| 26 Mar 2021 | £155,000 |
No other historical records.
26, Shipman Road, York YO43 3RB
| Today | See what it's worth now |
| 16 Feb 2026 | £297,000 |
| 29 Nov 2013 | £202,500 |
32, Lyon Avenue, York YO43 3GP
| Today | See what it's worth now |
| 16 Feb 2026 | £399,950 |
| 30 Nov 2018 | £349,995 |
No other historical records.
6, Bow Bridge Close, York YO43 3FH
| Today | See what it's worth now |
| 16 Feb 2026 | £270,000 |
| 9 Aug 2022 | £250,000 |
32, Lysander Drive, York YO43 3NQ
| Today | See what it's worth now |
| 16 Feb 2026 | £315,000 |
| 19 Apr 2021 | £260,000 |
18, Westfield Crescent, York YO43 3EL
| Today | See what it's worth now |
| 13 Feb 2026 | £167,500 |
| 28 Apr 2017 | £126,000 |
9, Old Mill Close, York YO43 3DU
| Today | See what it's worth now |
| 12 Feb 2026 | £250,000 |
| 1 Aug 2014 | £172,000 |
Source Acknowledgement: © Crown copyright. England and Wales house price data is publicly available information produced by the HM Land Registry.This material was last updated on 9 July 2026. It covers the period from 1 January 1995 to 30 April 2026 and contains property transactions which have been registered during that period. Contains HM Land Registry data © Crown copyright and database right 2026. This data is licensed under the Open Government Licence v3.0.
Disclaimer: Rightmove.co.uk provides this HM Land Registry data "as is". The burden for fitness of the data relies completely with the user and is provided for informational purposes only. No warranty, express or implied, is given relating to the accuracy of content of the HM Land Registry data and Rightmove does not accept any liability for error or omission. If you have found an error with the data or need further information please contact HM Land Registry.
Permitted Use: Viewers of this Information are granted permission to access this Crown copyright material and to download it onto electronic, magnetic, optical or similar storage media provided that such activities are for private research, study or in-house use only. Any other use of the material requires the formal written permission of Land Registry which can be requested from us, and is subject to an additional licence and associated charge.
Rightmove takes no liability for your use of, or reliance on, Rightmove's Instant Valuation due to the limitations of our tracking tool listed here. Use of this tool is taken entirely at your own risk. All rights reserved.