
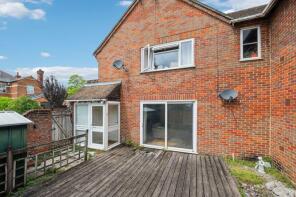
House Prices in Marlow
House prices in Marlow have an overall average of £709,019 over the last year.
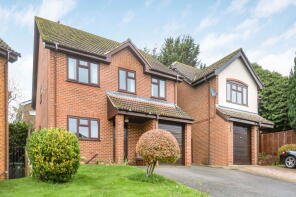
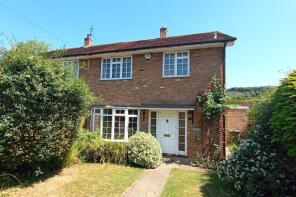
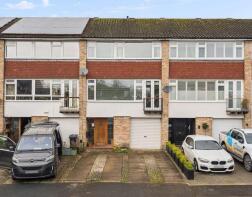
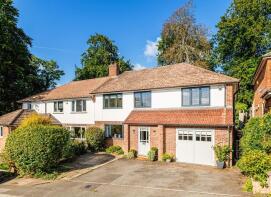
The majority of properties sold in Marlow during the last year were detached properties, selling for an average price of £983,214. Terraced properties sold for an average of £602,516, with flats fetching £394,539.
Overall, the historical sold prices in Marlow over the last year were 7% down on the previous year and 11% down on the 2022 peak of £793,303.
Properties Sold
30, Grainger House, Findlay Mews, Marlow SL7 1AP
| Today | See what it's worth now |
| 15 Apr 2026 | £327,000 |
| 24 Mar 2016 | £325,000 |
No other historical records.
7, Copse Close, Marlow SL7 2NY
| Today | See what it's worth now |
| 30 Mar 2026 | £700,000 |
| 22 Aug 2012 | £359,950 |
No other historical records.
18, Douglas Court, Marlow SL7 1UQ
| Today | See what it's worth now |
| 27 Mar 2026 | £424,000 |
| 18 Dec 2020 | £346,000 |
51, Queens Road, Marlow SL7 2PT
| Today | See what it's worth now |
| 27 Mar 2026 | £386,000 |
| 25 Jan 2022 | £365,000 |
21, Redgrave Place, Marlow SL7 1JZ
| Today | See what it's worth now |
| 27 Mar 2026 | £550,000 |
| 29 May 2013 | £345,000 |
73, New Road, Marlow SL7 3NN
| Today | See what it's worth now |
| 24 Mar 2026 | £940,000 |
| 24 Jan 2014 | £580,000 |
13, Mead Close, Marlow SL7 1HR
| Today | See what it's worth now |
| 23 Mar 2026 | £499,950 |
| 15 Dec 2020 | £450,000 |
Niton Cottage, Mundaydean Lane, Marlow SL7 3BU
| Today | See what it's worth now |
| 23 Mar 2026 | £1,000,000 |
| 12 Jul 1996 | £280,000 |
No other historical records.
10, Cedar Drive, Marlow SL7 3QB
| Today | See what it's worth now |
| 19 Mar 2026 | £765,000 |
| 28 Oct 2022 | £635,000 |
No other historical records.
229, Marlow Bottom SL7 3PZ
| Today | See what it's worth now |
| 12 Mar 2026 | £700,000 |
No other historical records.
11, Pound Lane, Marlow SL7 2AH
| Today | See what it's worth now |
| 12 Mar 2026 | £1,200,000 |
| 1 Aug 2017 | £1,000,000 |
172, West Street, Marlow SL7 2BU
| Today | See what it's worth now |
| 12 Mar 2026 | £610,000 |
| 3 Aug 2006 | £355,000 |
No other historical records.
6, Barons Court, Dedmere Rise, Marlow SL7 1XX
| Today | See what it's worth now |
| 5 Mar 2026 | £345,000 |
| 3 Apr 2014 | £285,000 |
16, Monks Hollow, Marlow Bottom SL7 3SY
| Today | See what it's worth now |
| 2 Mar 2026 | £723,000 |
No other historical records.
Berkleys, Bisham Village, Marlow Road, Bisham, Marlow SL7 1RR
| Today | See what it's worth now |
| 27 Feb 2026 | £525,000 |
| 18 Feb 2005 | £310,000 |
No other historical records.
202, Oxford Road, Marlow SL7 2PR

| Today | See what it's worth now |
| 27 Feb 2026 | £675,000 |
| 3 May 2023 | £510,000 |
No other historical records.
6, Rookery Court, Marlow SL7 3HR
| Today | See what it's worth now |
| 25 Feb 2026 | £620,000 |
| 31 Jan 2020 | £512,500 |
21, Highfield Park, Marlow SL7 2DE
| Today | See what it's worth now |
| 24 Feb 2026 | £1,190,000 |
| 4 Sep 2002 | £498,500 |
41, Victoria Road, Marlow SL7 1DW
| Today | See what it's worth now |
| 20 Feb 2026 | £250,000 |
| 15 Feb 2010 | £250,000 |
13, Newfield Gardens, Marlow SL7 1JN
| Today | See what it's worth now |
| 20 Feb 2026 | £567,000 |
No other historical records.
3, Spinners Walk, Marlow SL7 2AL
| Today | See what it's worth now |
| 18 Feb 2026 | £1,030,000 |
| 4 May 2011 | £720,000 |
No other historical records.
3, Nugent Court, Marlow SL7 1UT
| Today | See what it's worth now |
| 18 Feb 2026 | £200,000 |
| 17 Nov 2006 | £132,000 |
No other historical records.
4, Shelley Road, Marlow SL7 1LZ
| Today | See what it's worth now |
| 18 Feb 2026 | £390,000 |
No other historical records.
Source Acknowledgement: © Crown copyright. England and Wales house price data is publicly available information produced by the HM Land Registry.This material was last updated on 9 July 2026. It covers the period from 1 January 1995 to 30 April 2026 and contains property transactions which have been registered during that period. Contains HM Land Registry data © Crown copyright and database right 2026. This data is licensed under the Open Government Licence v3.0.
Disclaimer: Rightmove.co.uk provides this HM Land Registry data "as is". The burden for fitness of the data relies completely with the user and is provided for informational purposes only. No warranty, express or implied, is given relating to the accuracy of content of the HM Land Registry data and Rightmove does not accept any liability for error or omission. If you have found an error with the data or need further information please contact HM Land Registry.
Permitted Use: Viewers of this Information are granted permission to access this Crown copyright material and to download it onto electronic, magnetic, optical or similar storage media provided that such activities are for private research, study or in-house use only. Any other use of the material requires the formal written permission of Land Registry which can be requested from us, and is subject to an additional licence and associated charge.
Rightmove takes no liability for your use of, or reliance on, Rightmove's Instant Valuation due to the limitations of our tracking tool listed here. Use of this tool is taken entirely at your own risk. All rights reserved.