
House Prices in Maylandsea
House prices in Maylandsea have an overall average of £539,726 over the last year.
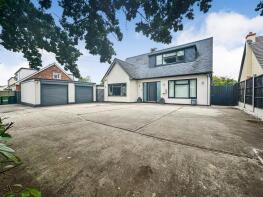
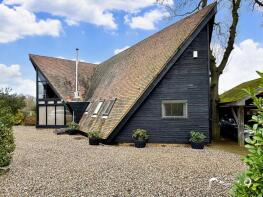
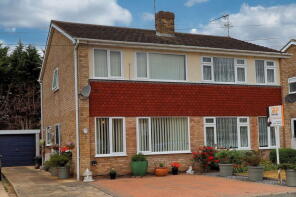
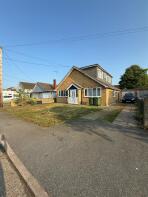
The majority of properties sold in Maylandsea during the last year were detached properties, selling for an average price of £640,841. Semi-detached properties sold for an average of £381,568, with terraced properties fetching £298,000.
Overall, the historical sold prices in Maylandsea over the last year were 7% up on the previous year and 3% up on the 2022 peak of £523,631.
Properties Sold
New Austral House, Burnham Road, Chelmsford CM3 6DP
| Today | See what it's worth now |
| 27 Apr 2026 | £615,000 |
| 8 Feb 2019 | £509,000 |
Whispering Trees, Mayland Green, Chelmsford CM3 6BD
| Today | See what it's worth now |
| 14 Apr 2026 | £520,000 |
| 2 Jul 2014 | £260,000 |
No other historical records.
2, Elm Way, Chelmsford CM3 6GP

| Today | See what it's worth now |
| 10 Apr 2026 | £545,000 |
| 1 Mar 2019 | £555,000 |
No other historical records.
23a, Katonia Avenue, Chelmsford CM3 6AD

| Today | See what it's worth now |
| 8 Apr 2026 | £218,050 |
| 22 Jul 2022 | £400,000 |
71, Bramley Way, Chelmsford CM3 6ES
| Today | See what it's worth now |
| 27 Mar 2026 | £310,000 |
| 25 Jul 2003 | £143,500 |
4, Grebe Close, Chelmsford CM3 6TZ

| Today | See what it's worth now |
| 23 Mar 2026 | £350,000 |
| 6 Nov 2020 | £262,500 |
77 Farm View, The Street, Chelmsford CM3 6JS

| Today | See what it's worth now |
| 23 Mar 2026 | £205,000 |
| 8 Dec 2017 | £196,000 |
38, Princes Avenue, Chelmsford CM3 6BA
| Today | See what it's worth now |
| 20 Mar 2026 | £395,000 |
| 21 Mar 2022 | £395,000 |
17a, Wembley Avenue, Chelmsford CM3 6AY
| Today | See what it's worth now |
| 20 Mar 2026 | £345,000 |
| 1 Sep 2023 | £320,000 |
11, Bramley Way, Chelmsford CM3 6ER

| Today | See what it's worth now |
| 13 Mar 2026 | £412,500 |
| 16 Jul 2010 | £177,000 |
No other historical records.
53 Poppins, The Street, Chelmsford CM3 6JR
| Today | See what it's worth now |
| 6 Mar 2026 | £399,000 |
| 28 Apr 2022 | £385,000 |
No other historical records.
10, Princes Avenue, Chelmsford CM3 6BA

| Today | See what it's worth now |
| 2 Mar 2026 | £368,000 |
| 29 Nov 2002 | £127,500 |
No other historical records.
16, Bakersfield, The Drive, Chelmsford CM3 6GT
| Today | See what it's worth now |
| 27 Feb 2026 | £620,000 |
| 26 Oct 2000 | £221,000 |
No other historical records.
109, West Avenue, Chelmsford CM3 6AE
| Today | See what it's worth now |
| 23 Feb 2026 | £605,000 |
| 21 Aug 2015 | £415,000 |
9, Elder Road, Chelmsford CM3 6XD
| Today | See what it's worth now |
| 12 Feb 2026 | £395,000 |
| 31 May 2019 | £345,000 |
No other historical records.
2, The Fairways, Chelmsford CM3 6JJ
| Today | See what it's worth now |
| 11 Feb 2026 | £613,740 |
| 18 Sep 2020 | £527,500 |
5, Elder Road, Chelmsford CM3 6XD

| Today | See what it's worth now |
| 10 Feb 2026 | £345,000 |
| 15 Apr 2019 | £299,995 |
No other historical records.
21, Tern Close, Chelmsford CM3 6TW
| Today | See what it's worth now |
| 9 Feb 2026 | £231,000 |
| 3 Aug 2001 | £146,000 |
15, Granary Close, Chelmsford CM3 6HJ

| Today | See what it's worth now |
| 30 Jan 2026 | £285,000 |
| 17 May 2006 | £161,500 |
No other historical records.
Crown Lodge, Crown Road, Chelmsford CM3 6JF

| Today | See what it's worth now |
| 29 Jan 2026 | £1,250,000 |
| 18 Apr 2008 | £430,000 |
No other historical records.
3, Heron Way, Chelmsford CM3 6TP
| Today | See what it's worth now |
| 29 Jan 2026 | £396,000 |
| 14 Apr 2003 | £195,000 |
No other historical records.
Medlar House, Southminster Road, Chelmsford CM3 6EB
| Today | See what it's worth now |
| 19 Jan 2026 | £930,000 |
| 19 Jun 1996 | £165,000 |
No other historical records.
Wasdale, Summerhill, Chelmsford CM3 6BY
| Today | See what it's worth now |
| 15 Jan 2026 | £392,000 |
| 21 Sep 2020 | £332,500 |
Source Acknowledgement: © Crown copyright. England and Wales house price data is publicly available information produced by the HM Land Registry.This material was last updated on 9 July 2026. It covers the period from 1 January 1995 to 30 April 2026 and contains property transactions which have been registered during that period. Contains HM Land Registry data © Crown copyright and database right 2026. This data is licensed under the Open Government Licence v3.0.
Disclaimer: Rightmove.co.uk provides this HM Land Registry data "as is". The burden for fitness of the data relies completely with the user and is provided for informational purposes only. No warranty, express or implied, is given relating to the accuracy of content of the HM Land Registry data and Rightmove does not accept any liability for error or omission. If you have found an error with the data or need further information please contact HM Land Registry.
Permitted Use: Viewers of this Information are granted permission to access this Crown copyright material and to download it onto electronic, magnetic, optical or similar storage media provided that such activities are for private research, study or in-house use only. Any other use of the material requires the formal written permission of Land Registry which can be requested from us, and is subject to an additional licence and associated charge.
Rightmove takes no liability for your use of, or reliance on, Rightmove's Instant Valuation due to the limitations of our tracking tool listed here. Use of this tool is taken entirely at your own risk. All rights reserved.