
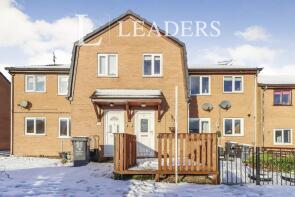
House Prices in Minera
House prices in Minera have an overall average of £273,387 over the last year.
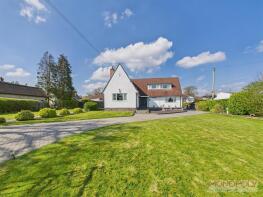
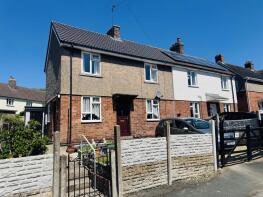
The majority of properties sold in Minera during the last year were detached properties, selling for an average price of £429,245. Semi-detached properties sold for an average of £144,125, with terraced properties fetching £167,000.
Overall, the historical sold prices in Minera over the last year were 21% up on the previous year and 1% up on the 2022 peak of £269,545.
Properties Sold
1, Aldergrove Place, Coedpoeth, Wrexham LL11 3NZ
| Today | See what it's worth now |
| 23 Jan 2026 | £84,500 |
| 7 Jun 1996 | £19,000 |
No other historical records.
1, Maes Meillion, Minera, Wrexham LL11 3YH
| Today | See what it's worth now |
| 12 Jan 2026 | £167,000 |
| 6 Mar 2006 | £53,750 |
No other historical records.
Fairmount, B5426 Wern Road, Pentre, Minera LL11 3DP
| Today | See what it's worth now |
| 19 Dec 2025 | £266,980 |
No other historical records.
Beechwood, Gegin Lane, Minera, Wrexham LL11 3YT

| Today | See what it's worth now |
| 3 Dec 2025 | £380,000 |
| 31 May 1995 | £80,000 |
No other historical records.
2, Shepherds Bush, Pen Y Palmant Road, Minera, Wrexham LL11 3YP
| Today | See what it's worth now |
| 24 Oct 2025 | £167,000 |
| 27 Jun 2014 | £82,000 |
Shangri La, Ruthin Road, Minera, Wrexham LL11 3UT
| Today | See what it's worth now |
| 22 Oct 2025 | £550,000 |
| 15 Jun 2023 | £565,000 |
1, White Lion Cottages, Lane From B5426 To New Brighton, New Brighton, Wrexham LL11 3DT

| Today | See what it's worth now |
| 3 Oct 2025 | £190,000 |
| 20 Mar 2024 | £200,000 |
3, Maes Meillion, Minera, Wrexham LL11 3YH
| Today | See what it's worth now |
| 15 Aug 2025 | £135,000 |
| 9 Sep 2002 | £15,840 |
No other historical records.
Tir Na Nog, Church Road, Minera, Wrexham LL11 3DD

| Today | See what it's worth now |
| 25 Jul 2025 | £520,000 |
| 21 Aug 2019 | £235,000 |
Woodwards Cottages, New Brighton, Minera LL11 3ED
| Today | See what it's worth now |
| 30 May 2025 | £260,000 |
| 12 Jul 1996 | £23,250 |
No other historical records.
23, Eversley Court, Minera, Wrexham LL11 3YZ
| Today | See what it's worth now |
| 27 May 2025 | £298,000 |
| 10 Feb 1995 | £68,000 |
No other historical records.
5, Aldergrove Place, Coedpoeth, Wrexham LL11 3NZ
| Today | See what it's worth now |
| 8 May 2025 | £75,000 |
No other historical records.
14, Bryn Hyfryd, Coedpoeth, Wrexham LL11 3YA
| Today | See what it's worth now |
| 7 Mar 2025 | £196,000 |
| 7 Oct 2011 | £100,000 |
No other historical records.
Arfryn, New Brighton, Minera LL11 3DT
| Today | See what it's worth now |
| 7 Nov 2024 | £330,000 |
No other historical records.
44, Aldergrove Place, Coedpoeth, Wrexham LL11 3NZ
| Today | See what it's worth now |
| 25 Oct 2024 | £99,000 |
No other historical records.
22, Gwern Y Gaseg Road, Coedpoeth, Wrexham LL11 3RE
| Today | See what it's worth now |
| 18 Oct 2024 | £170,000 |
| 13 Jan 2023 | £195,000 |
No other historical records.
59, Minera Hall Road, Minera, Wrexham LL11 3YD

| Today | See what it's worth now |
| 17 Sep 2024 | £150,000 |
| 11 Jun 2018 | £100,000 |
No other historical records.
The Chase, Ruthin Road, Minera, Wrexham LL11 3UT
| Today | See what it's worth now |
| 28 Aug 2024 | £150,000 |
| 20 Aug 2020 | £150,000 |
The Croft, Ruthin Road, Minera, Wrexham LL11 3UT
| Today | See what it's worth now |
| 28 Jun 2024 | £339,000 |
No other historical records.
21, Eversley Court, Minera, Wrexham LL11 3YZ

| Today | See what it's worth now |
| 21 Jun 2024 | £310,000 |
| 15 Feb 2013 | £232,500 |
No other historical records.
24, Eversley Court, Minera, Wrexham LL11 3YZ

| Today | See what it's worth now |
| 10 Jun 2024 | £330,000 |
| 19 Mar 2021 | £251,000 |
No other historical records.
45, Aldergrove Place, Coedpoeth, Wrexham LL11 3NZ

| Today | See what it's worth now |
| 19 Apr 2024 | £80,500 |
No other historical records.
42, Aldergrove Place, Coedpoeth, Wrexham LL11 3NZ

| Today | See what it's worth now |
| 12 Jan 2024 | £95,000 |
| 10 Oct 2000 | £34,000 |
No other historical records.
Source Acknowledgement: © Crown copyright. England and Wales house price data is publicly available information produced by the HM Land Registry.This material was last updated on 9 July 2026. It covers the period from 1 January 1995 to 30 April 2026 and contains property transactions which have been registered during that period. Contains HM Land Registry data © Crown copyright and database right 2026. This data is licensed under the Open Government Licence v3.0.
Disclaimer: Rightmove.co.uk provides this HM Land Registry data "as is". The burden for fitness of the data relies completely with the user and is provided for informational purposes only. No warranty, express or implied, is given relating to the accuracy of content of the HM Land Registry data and Rightmove does not accept any liability for error or omission. If you have found an error with the data or need further information please contact HM Land Registry.
Permitted Use: Viewers of this Information are granted permission to access this Crown copyright material and to download it onto electronic, magnetic, optical or similar storage media provided that such activities are for private research, study or in-house use only. Any other use of the material requires the formal written permission of Land Registry which can be requested from us, and is subject to an additional licence and associated charge.
Rightmove takes no liability for your use of, or reliance on, Rightmove's Instant Valuation due to the limitations of our tracking tool listed here. Use of this tool is taken entirely at your own risk. All rights reserved.