
House Prices in Minworth
House prices in Minworth have an overall average of £279,775 over the last year.
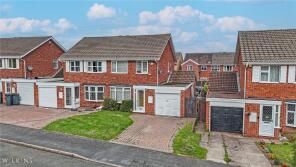
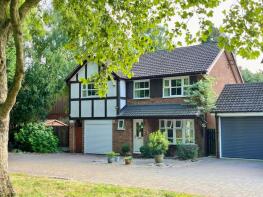
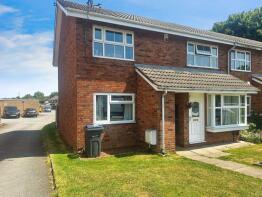
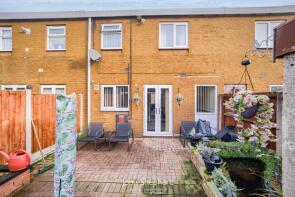
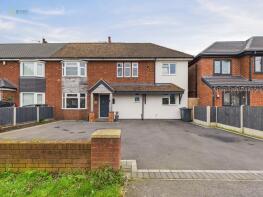
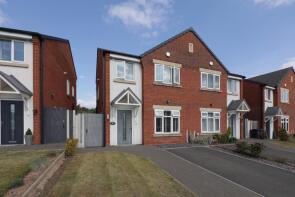
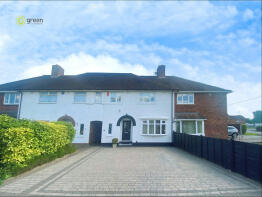
The majority of properties sold in Minworth during the last year were semi-detached properties, selling for an average price of £341,600. Terraced properties sold for an average of £255,667, with flats fetching £148,479.
Overall, the historical sold prices in Minworth over the last year were 5% up on the previous year and 5% down on the 2022 peak of £295,538.
Properties Sold
15, Stapleton Close, Sutton Coldfield B76 1XT
| Today | See what it's worth now |
| 22 Apr 2026 | £320,000 |
| 18 Dec 2019 | £247,000 |
65, Marfield Close, Minworth, Sutton Coldfield B76 1YD
| Today | See what it's worth now |
| 4 Mar 2026 | £500,000 |
No other historical records.
79, Winton Grove, Sutton Coldfield B76 1XE
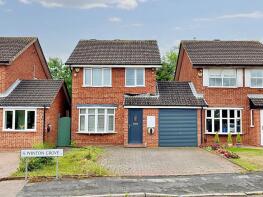
| Today | See what it's worth now |
| 27 Feb 2026 | £313,500 |
| 9 Nov 2016 | £220,000 |
28, Anton Drive, Sutton Coldfield B76 1XG
| Today | See what it's worth now |
| 13 Feb 2026 | £160,000 |
| 15 Dec 2000 | £60,000 |
No other historical records.
57b, Water Orton Lane, Sutton Coldfield B76 9BD
| Today | See what it's worth now |
| 9 Feb 2026 | £405,000 |
| 4 Nov 2022 | £377,500 |
No other historical records.
90, Cheswood Drive, Sutton Coldfield B76 1YA
| Today | See what it's worth now |
| 30 Jan 2026 | £165,000 |
| 31 Aug 2023 | £175,000 |
No other historical records.
40, Cheswood Drive, Sutton Coldfield B76 1YE
| Today | See what it's worth now |
| 22 Dec 2025 | £120,000 |
| 26 Jun 2002 | £72,000 |
No other historical records.
5, Lawrence Drive, Sutton Coldfield B76 9AX
| Today | See what it's worth now |
| 19 Dec 2025 | £262,000 |
| 17 Nov 2017 | £185,000 |
10, Lindridge Drive, Sutton Coldfield B76 9RQ
| Today | See what it's worth now |
| 10 Dec 2025 | £137,000 |
| 9 Dec 2020 | £95,000 |
6, Water Orton Lane, Sutton Coldfield B76 9BU
| Today | See what it's worth now |
| 5 Dec 2025 | £385,000 |
| 18 Dec 2007 | £249,950 |
152, Cheswood Drive, Sutton Coldfield B76 1XY
| Today | See what it's worth now |
| 21 Nov 2025 | £102,000 |
| 10 Mar 2006 | £119,000 |
No other historical records.
1, Lawrence Drive, Sutton Coldfield B76 9AX
| Today | See what it's worth now |
| 21 Nov 2025 | £275,000 |
| 26 Mar 2021 | £232,500 |
47, Water Orton Lane, Sutton Coldfield B76 9BD
| Today | See what it's worth now |
| 14 Nov 2025 | £360,000 |
| 21 Aug 2015 | £170,000 |
No other historical records.
5, Coneybury Walk, Sutton Coldfield B76 9RE
| Today | See what it's worth now |
| 10 Nov 2025 | £230,000 |
| 11 Aug 2006 | £129,950 |
30, Summer Lane, Sutton New Hall, Sutton Coldfield B76 9AU
| Today | See what it's worth now |
| 6 Oct 2025 | £383,000 |
| 30 Mar 2007 | £167,500 |
No other historical records.
85, Water Orton Lane, Sutton Coldfield B76 9BD
| Today | See what it's worth now |
| 3 Oct 2025 | £338,000 |
| 3 Oct 2025 | £338,000 |
17, Whitehead Drive, Sutton Coldfield B76 9AN
| Today | See what it's worth now |
| 29 Aug 2025 | £282,000 |
| 11 Nov 2005 | £150,000 |
13, Oakenhayes Crescent, Sutton Coldfield B76 9RP
| Today | See what it's worth now |
| 27 Aug 2025 | £340,000 |
| 12 Feb 2021 | £292,500 |
10, Summer Lane, Sutton New Hall, Sutton Coldfield B76 9AU
| Today | See what it's worth now |
| 20 Aug 2025 | £285,000 |
| 14 May 2021 | £212,000 |
No other historical records.
87, Lindridge Drive, Sutton Coldfield B76 9RJ
| Today | See what it's worth now |
| 7 Aug 2025 | £285,000 |
| 2 May 2014 | £155,000 |
23, Moreland Croft, Sutton Coldfield B76 1XZ
| Today | See what it's worth now |
| 28 Jul 2025 | £450,000 |
| 18 Nov 2019 | £270,000 |
No other historical records.
50, Anton Drive, Sutton Coldfield B76 1XG
| Today | See what it's worth now |
| 25 Jul 2025 | £156,000 |
| 14 Mar 2019 | £120,000 |
29, Redmoor Way, Sutton Coldfield B76 9RG
| Today | See what it's worth now |
| 25 Jul 2025 | £250,000 |
No other historical records.

Source Acknowledgement: © Crown copyright. England and Wales house price data is publicly available information produced by the HM Land Registry.This material was last updated on 9 July 2026. It covers the period from 1 January 1995 to 30 April 2026 and contains property transactions which have been registered during that period. Contains HM Land Registry data © Crown copyright and database right 2026. This data is licensed under the Open Government Licence v3.0.
Disclaimer: Rightmove.co.uk provides this HM Land Registry data "as is". The burden for fitness of the data relies completely with the user and is provided for informational purposes only. No warranty, express or implied, is given relating to the accuracy of content of the HM Land Registry data and Rightmove does not accept any liability for error or omission. If you have found an error with the data or need further information please contact HM Land Registry.
Permitted Use: Viewers of this Information are granted permission to access this Crown copyright material and to download it onto electronic, magnetic, optical or similar storage media provided that such activities are for private research, study or in-house use only. Any other use of the material requires the formal written permission of Land Registry which can be requested from us, and is subject to an additional licence and associated charge.
Rightmove takes no liability for your use of, or reliance on, Rightmove's Instant Valuation due to the limitations of our tracking tool listed here. Use of this tool is taken entirely at your own risk. All rights reserved.