
House Prices in Molesey
House prices in Molesey have an overall average of £628,235 over the last year.
The majority of properties sold in Molesey during the last year were semi-detached properties, selling for an average price of £820,772. Flats sold for an average of £392,792, with terraced properties fetching £517,523.
Overall, the historical sold prices in Molesey over the last year were 5% down on the previous year and 16% down on the 2022 peak of £747,190.
Properties Sold
51, Berkeley Drive, West Molesey KT8 1RA
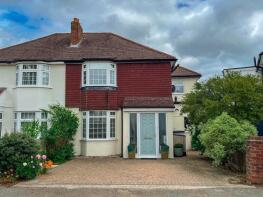
| Today | See today's value |
| 21 Aug 2026 | £750,000 |
| 15 Jul 2011 | £429,950 |
6, Carlyle Close, West Molesey KT8 1SX
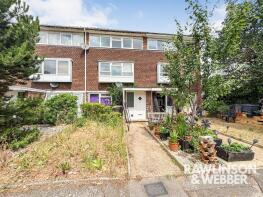
| Today | See today's value |
| 20 Aug 2026 | £360,000 |
| 31 Mar 2000 | £112,000 |
No other historical records.
24, Summer Road, East Molesey KT8 9LS
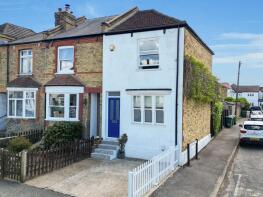
| Today | See today's value |
| 14 Aug 2026 | £635,000 |
| 29 Apr 2005 | £342,000 |
19, Beauchamp Road, East Molesey KT8 0PA
| Today | See today's value |
| 13 Aug 2026 | £1,412,500 |
No other historical records.
27, Spreighton Road, West Molesey KT8 2JF
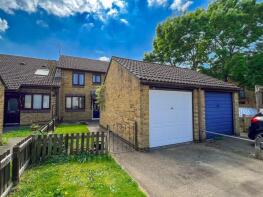
| Today | See today's value |
| 11 Aug 2026 | £520,000 |
| 24 Aug 2017 | £417,500 |
48, Kings Chase, East Molesey KT8 9DG
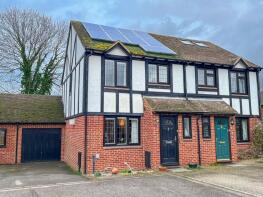
| Today | See today's value |
| 11 Aug 2026 | £586,000 |
| 19 Dec 1996 | £110,000 |
No other historical records.
49, Kelvinbrook, West Molesey KT8 1RU
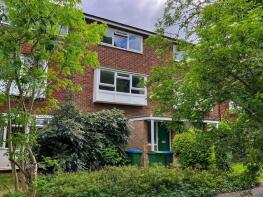
| Today | See today's value |
| 11 Aug 2026 | £335,000 |
No other historical records.
18, New Road, West Molesey KT8 1QB
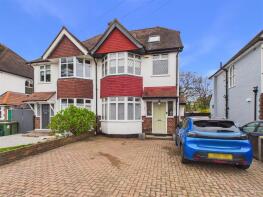
| Today | See today's value |
| 4 Aug 2026 | £780,000 |
| 16 Feb 2007 | £430,000 |
200, Ember Lane, East Molesey KT8 0BS

| Today | See today's value |
| 3 Aug 2026 | £885,000 |
| 23 Mar 2005 | £405,000 |
No other historical records.
103a Wolsey House, Palace Road, East Molesey KT8 9DU

| Today | See today's value |
| 31 Jul 2026 | £2,747,000 |
| 25 Aug 2021 | £2,475,000 |
42, Wolsey Road, East Molesey KT8 9EN
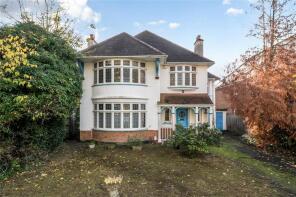
| Today | See today's value |
| 31 Jul 2026 | £1,400,000 |
No other historical records.
27, First Avenue, West Molesey KT8 2QJ
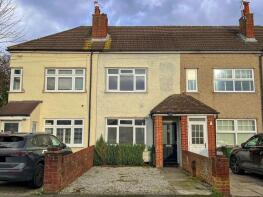
| Today | See today's value |
| 24 Jul 2026 | £400,000 |
| 26 Apr 2024 | £415,000 |
14, Molesham Way, West Molesey KT8 1NT
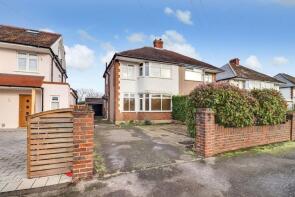
| Today | See today's value |
| 23 Jul 2026 | £592,500 |
| 6 Mar 2020 | £485,000 |
Flat 4, 48 Styles Court, Walton Road, East Molesey KT8 0DQ
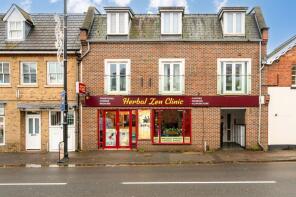
| Today | See today's value |
| 22 Jul 2026 | £240,000 |
| 13 Dec 2007 | £178,000 |
No other historical records.
21, School Road, East Molesey KT8 0DN
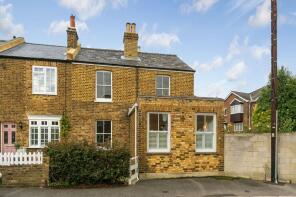
| Today | See today's value |
| 17 Jul 2026 | £730,000 |
No other historical records.
4, Candle Mews, Walton Road, East Molesey KT8 0GZ
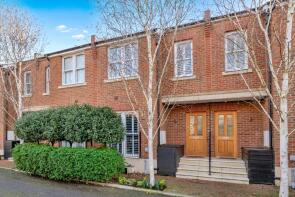
| Today | See today's value |
| 13 Jul 2026 | £775,000 |
| 1 Mar 2018 | £620,000 |
7, Park Way, West Molesey KT8 1PE
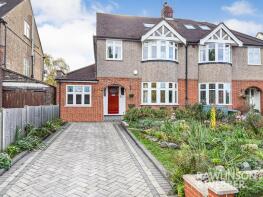
| Today | See today's value |
| 13 Jul 2026 | £970,000 |
| 11 Aug 2006 | £410,000 |
No other historical records.
Flat 74, Catherine Parr House, Queens Reach, East Molesey KT8 9DE
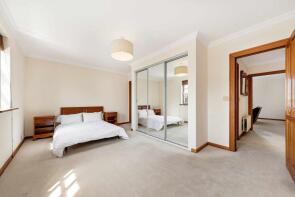
| Today | See today's value |
| 10 Jul 2026 | £580,000 |
| 23 Mar 2006 | £320,000 |
129, Kings Chase, East Molesey KT8 9DH

| Today | See today's value |
| 10 Jul 2026 | £228,750 |
| 8 Dec 2006 | £158,250 |
496, Walton Road, West Molesey KT8 2QF
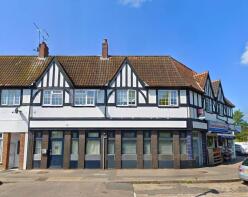
| Today | See today's value |
| 9 Jul 2026 | £190,000 |
| 13 May 2016 | £225,000 |
No other historical records.
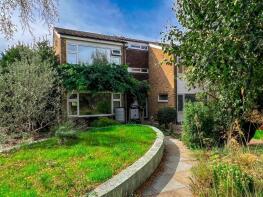
80, Buckingham Gardens, West Molesey KT8 1TN
| Today | See today's value |
| 8 Jul 2026 | £605,000 |
| 24 Sep 2009 | £260,000 |
No other historical records.
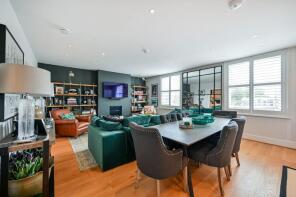
Flat 1, 5a, Bridge Road, East Molesey KT8 9EU
| Today | See today's value |
| 3 Jul 2026 | £390,000 |
| 17 Feb 2023 | £550,000 |
No other historical records.
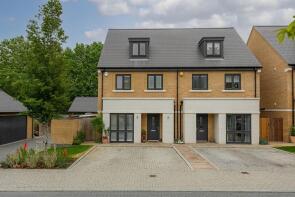
1, Orchard Farm Avenue, East Molesey KT8 0AJ
| Today | See today's value |
| 29 Jun 2026 | £900,000 |
| 8 Dec 2021 | £925,000 |
Rightmove takes no liability for your use of, or reliance on, Rightmove's Instant Valuation due to the limitations of our tracking tool listed here. Use of this tool is taken entirely at your own risk. All rights reserved.