
House Prices in Mount Pleasant
House prices in Mount Pleasant have an overall average of £540,062 over the last year.
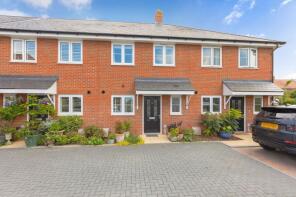
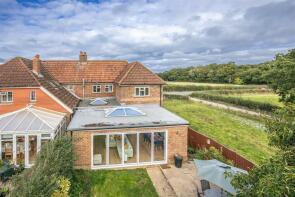
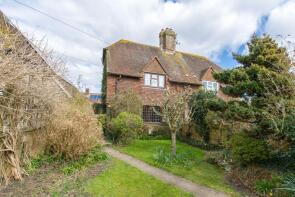
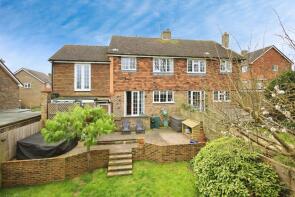
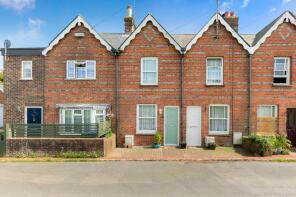
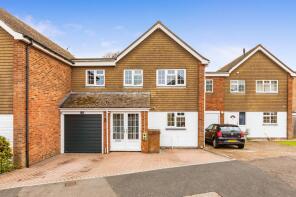
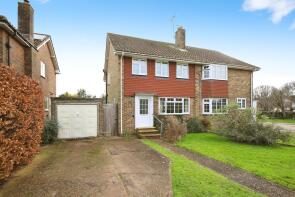
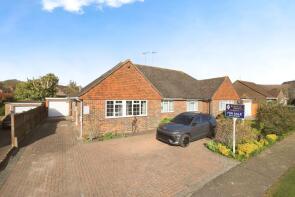
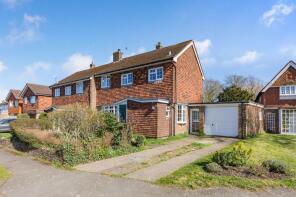
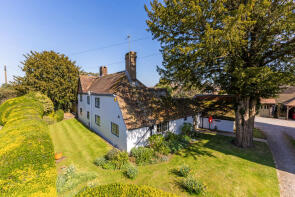
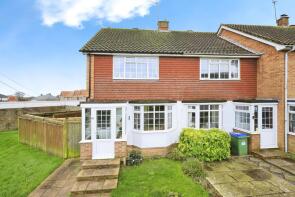
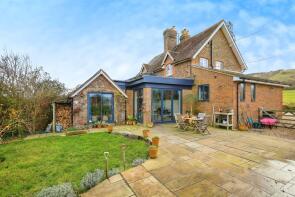
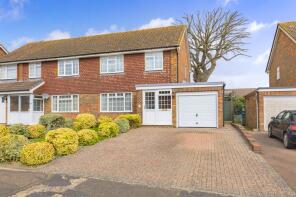
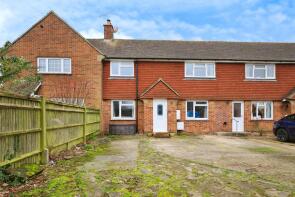
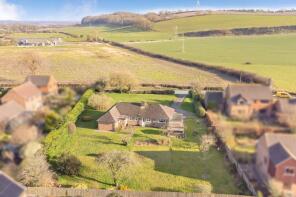
The majority of properties sold in Mount Pleasant during the last year were semi-detached properties, selling for an average price of £505,615. Detached properties sold for an average of £732,308, with terraced properties fetching £404,503.
Overall, the historical sold prices in Mount Pleasant over the last year were 18% up on the previous year and 9% up on the 2022 peak of £496,642.
Properties Sold
53, Sadlers Way, Lewes BN8 5HG

| Today | See what it's worth now |
| 27 Nov 2025 | £700,000 |
| 9 Oct 1996 | £155,000 |
No other historical records.
13, Northill Close, Lewes BN8 5GG
| Today | See what it's worth now |
| 25 Nov 2025 | £395,000 |
| 6 Jan 2023 | £372,500 |
No other historical records.
Upper Clayhill Cottage, Uckfield Road, Ringmer BN8 5RR
| Today | See what it's worth now |
| 24 Nov 2025 | £540,000 |
No other historical records.
2, Mill Path, Lewes BN8 5JH
| Today | See what it's worth now |
| 7 Nov 2025 | £328,000 |
| 15 Mar 2012 | £210,000 |
No other historical records.
32, Grantham Bank, Lewes BN8 5DJ
| Today | See what it's worth now |
| 6 Nov 2025 | £550,000 |
| 28 May 1999 | £135,000 |
No other historical records.
8, The Orchards, Lewes BN8 5FR


| Today | See what it's worth now |
| 6 Nov 2025 | £464,950 |
| 3 Dec 2020 | £435,000 |
No other historical records.
7, North Road, Lewes BN8 5JS
| Today | See what it's worth now |
| 15 Oct 2025 | £393,000 |
| 14 Oct 2016 | £315,000 |
29, Christie Avenue, Lewes BN8 5JT
| Today | See what it's worth now |
| 14 Oct 2025 | £549,000 |
| 30 Jul 2010 | £290,000 |
23, Springett Avenue, Lewes BN8 5HD
| Today | See what it's worth now |
| 12 Sep 2025 | £450,000 |
| 18 Dec 2020 | £400,000 |
No other historical records.
59, Harvard Road, Ringmer BN8 5JF
| Today | See what it's worth now |
| 10 Sep 2025 | £570,000 |
No other historical records.
1, Grantham Bank, Lewes BN8 5DJ
| Today | See what it's worth now |
| 10 Sep 2025 | £469,000 |
| 12 Jun 1997 | £114,000 |
No other historical records.
The Yews, Lewes Road, Lewes BN8 5ET
| Today | See what it's worth now |
| 1 Sep 2025 | £850,000 |
| 25 May 2007 | £495,000 |
No other historical records.
83, Springett Avenue, Lewes BN8 5QT
| Today | See what it's worth now |
| 29 Aug 2025 | £345,250 |
| 18 Sep 2012 | £210,000 |
10, Twin Cottages, Upper Stoneham, Lewes BN8 5RH
| Today | See what it's worth now |
| 29 Aug 2025 | £725,000 |
| 7 Oct 2011 | £300,000 |
No other historical records.
7, Hayes Close, Ringmer BN8 5HN
| Today | See what it's worth now |
| 28 Aug 2025 | £485,000 |
No other historical records.
29, Anchor Field, Lewes BN8 5QN
| Today | See what it's worth now |
| 8 Aug 2025 | £385,000 |
| 14 May 2010 | £223,000 |
Rest Harrow, Gote Lane, Lewes BN8 5HU
| Today | See what it's worth now |
| 8 Aug 2025 | £865,000 |
| 30 Aug 1999 | £114,380 |
No other historical records.
7, Bellamy Gardens, Lewes Road, Ringmer BN8 5ES
| Today | See what it's worth now |
| 4 Aug 2025 | £725,000 |
No other historical records.
Flat 43, Delves House East, Delves Close, Lewes BN8 5EW
| Today | See what it's worth now |
| 30 Jul 2025 | £126,000 |
| 12 Jun 2013 | £115,000 |
5, Elphick Road, Lewes BN8 5PR
| Today | See what it's worth now |
| 24 Jul 2025 | £295,000 |
| 3 Apr 2014 | £227,500 |
3, Butlers Way, Lewes BN8 5DQ
| Today | See what it's worth now |
| 7 Jul 2025 | £570,000 |
| 28 Nov 2022 | £600,000 |
3, Craig Meadows, Lewes BN8 5FB
| Today | See what it's worth now |
| 20 Jun 2025 | £400,000 |
| 29 Mar 2017 | £370,000 |
4, Byron Close, Lewes BN8 5FQ
| Today | See what it's worth now |
| 13 Jun 2025 | £875,000 |
| 18 Nov 2020 | £750,000 |
No other historical records.
Sunnyside, Shelley Road, Lewes BN8 5QR

| Today | See what it's worth now |
| 20 May 2025 | £545,000 |
No other historical records.
The Studio, The Gables, High Street, Lewes BN8 5DH
| Today | See what it's worth now |
| 17 Apr 2025 | £368,772 |
| 29 Jun 2022 | £337,000 |
Source Acknowledgement: © Crown copyright. England and Wales house price data is publicly available information produced by the HM Land Registry.This material was last updated on 4 February 2026. It covers the period from 1 January 1995 to 24 December 2025 and contains property transactions which have been registered during that period. Contains HM Land Registry data © Crown copyright and database right 2026. This data is licensed under the Open Government Licence v3.0.
Disclaimer: Rightmove.co.uk provides this HM Land Registry data "as is". The burden for fitness of the data relies completely with the user and is provided for informational purposes only. No warranty, express or implied, is given relating to the accuracy of content of the HM Land Registry data and Rightmove does not accept any liability for error or omission. If you have found an error with the data or need further information please contact HM Land Registry.
Permitted Use: Viewers of this Information are granted permission to access this Crown copyright material and to download it onto electronic, magnetic, optical or similar storage media provided that such activities are for private research, study or in-house use only. Any other use of the material requires the formal written permission of Land Registry which can be requested from us, and is subject to an additional licence and associated charge.
Map data ©OpenStreetMap contributors.
Rightmove takes no liability for your use of, or reliance on, Rightmove's Instant Valuation due to the limitations of our tracking tool listed here. Use of this tool is taken entirely at your own risk. All rights reserved.